

Information
Contents
DISCLAIMER: The words and views expressed here solely represent the findings made by this group and by no means those of the University of Southampton.
Date: 23rd June 2016
Time (GMT): 07:04 to 16:36
Low Tides (GMT): 01:04, 13:21
High Tides (GMT): 06:56, 19:08
Tidal Range: 4.2m
Weather Conditions: ranging from 3/8’s cloud cover oktas and very sunny to more overcast conditions.
|
Station |
Latitude |
Longitude |
|
13 |
50° 07.462’ N |
004° 58.605’ W |
|
14 |
50° 02.356’ N |
004° 22.310’ W |
|
15 |
50° 02.443’ N |
004° 23.113’ W |
|
16 |
50° 03.440’ N |
004° 36.115’ W |
|
17 |
50° 05.564’ N |
004° 51.796’ W |
Introduction
Offshore surveying was done via Callista on 23rd June 2016. The aim of the survey was to sample the water column along the seasonal front in order to collect and compare data between different stations.The samples were taken over a long range of distances with all samples falling between locations 50° 07.462’ N, 004°58.605 W and 50° 02.356’ N, 004° 22.310’ W, which were taken between times 7:04 GMT and 16:36 GMT. The prevailing northerly winds and calm sea state allowed us to plan our course as far out as The Western Channel Observatory station E1, located in the open shelf approximately 25 nautical miles south-west of Plymouth. The samples collected were investigating a number of variables including temperature, salinity and fluorescence facilitating the production of several depth profiles exploring the differences in stratification with depth from the Fal estuary.
Methods
Physical, chemical and biological properties were measured along the front at 5 stations, starting from Station 13 near to the Falmouth coast, through to Station 15 which was located close to the E1 autonomous buoy. Salinity, temperature, pressure, turbidity, irradiance, conductivity, density and fluorescence was measured with depth using a CTD attached to a rosette. The CTD profiles were studied to decide where to collect samples from the water column using Niskin bottles attached to the rosette. dissolved oxygen, silicate, nitrate, phosphate, chlorophyll, phytoplankton and zooplankton were taken from these water bottles and analysed in the laboratory on 24/6/16. At station 17 only a CTD profile was taken and no Niskin bottle samples were collected.
- Dissolved oxygen: water was added immediately to a glass bottle and manganese chloride and alkaline iodide were added to form a precipitate. These bottles were stored in a bucket of water to prevent any changes in oxygen levels.
- Silicate: water was passed through a 50 ml syringe and filter. The samples were then stored in numbered plastic bottles and placed in a fridge. The procedure was repeated, with the change that water was stored in a glass bottle. This was done to collect water for nitrate and phosphate analysis.
- Chlorophyll: Three replicates were taken and filtered in the same way as the nutrients and stored in acetone for later laboratory analysis.
- Phytoplankton: water samples were taken and stored in Lugols solution to dye them.
- Zooplankton:samples were collected using a weighted net which was closed at a specific depth using a brass messenger. Samples were preserved using 10% formalin solution and later analysed in the laboratory using a light microscope.
- The ADCP was used to record transects of velocity, back scatter and flow for each station and in transit between stations.
Figure 21: Table of latitudes and longitudes for offshore sites.
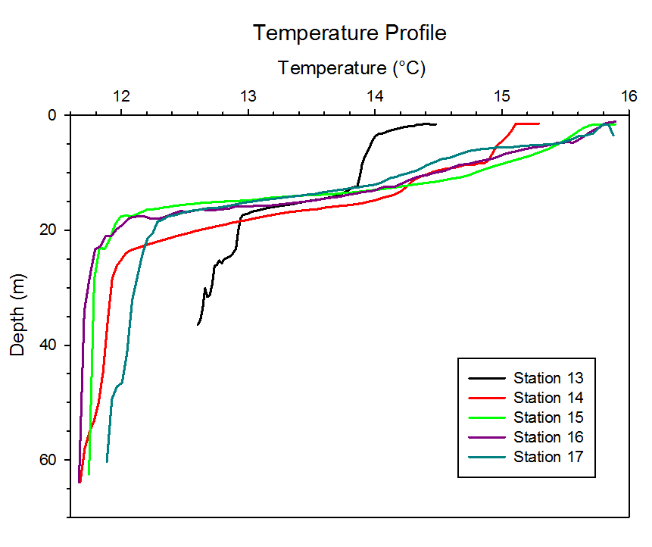
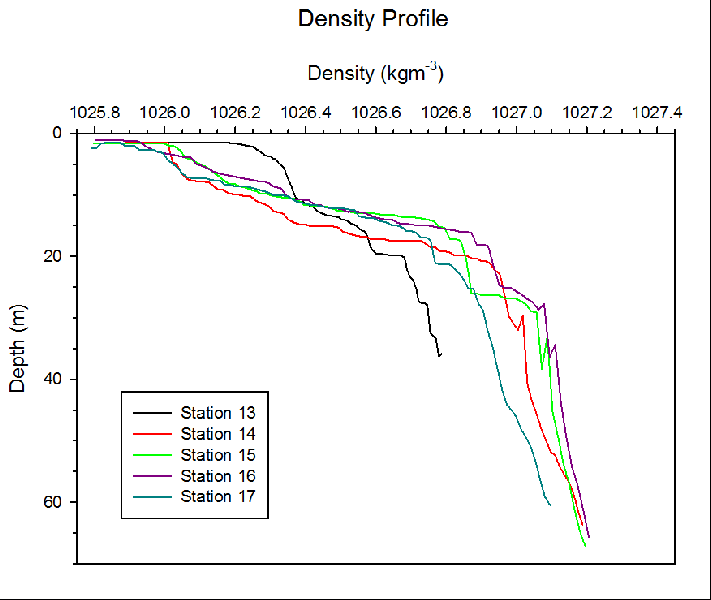
A significant decline in water temperature was observed at approximately 20 m at all five sampling stations (Figure 27). This suggests that thermal stratification existed. The presence of a thermocline is supported by Figure 29. Density was relatively low in the upper 20 m of water column, after which point it increased sharply. The water column can, therefore, be separated into a relatively warm and less dense layer at the surface and a cooler and more dense layer below 20 m water depth. The surface water temperature at Station 13 was lower than at other sites. This was because the site was located relatively close to the mouth of the Fal estuary. As a result, the relatively cool riverwater was still influential.
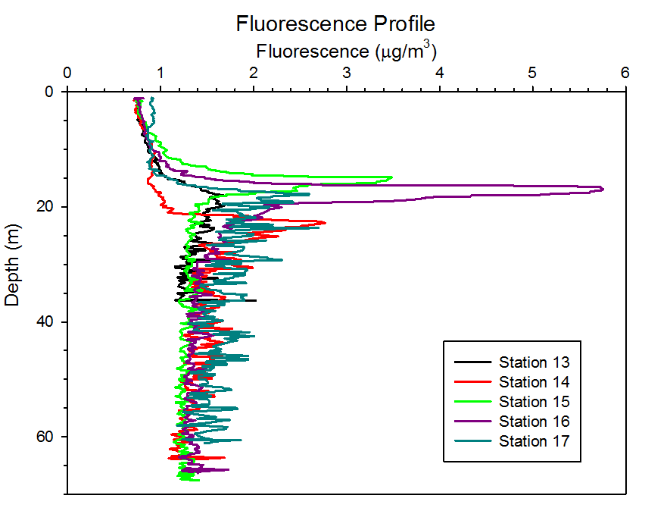
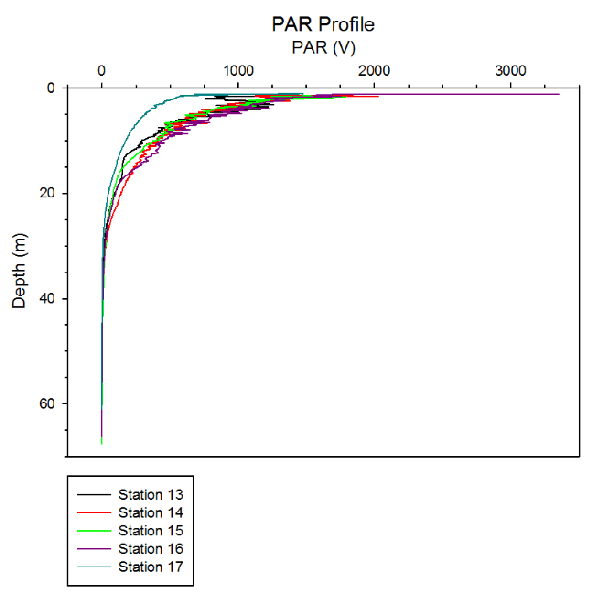
Fluorescence increased sharply at approximately 20 m at all sampling stations (Figure 23). This suggests that chlorophyll concentration was higher at the thermocline. A decline in turbidity was observed over a similar depth range (Figure y). These results indicate that a sub-surface chlorophyll maximum existed. Phytoplankton were able to ‘bloom’ at this depth due to the relative availability of light and nutrients (Figures 23 & 26). PAR decreased exponentially with depth (Figure 25). This was expected as light is scattered by particles and absorbed by water molecules (Pegau et al., 1997). However, at 20 m, sufficient light is still present to support a net photosynthetic population (Tett, 1990). Furthermore, nutrient concentrations are relatively high in this band of water (Figure 26). As a consequence of this sub-surface chlorophyll maximum, zooplankton were more abundant between 22-28 m compared to the surface. This was because prey density was greater, which facilitated an increased growth rate (Miller, 2004). The zooplankton communities at Station 15 and 16 (figure 30b, c and d respectively) are similar, suggesting they are subject to the same conditions. However, issues with the zooplankton procedure, such as subjectivity and misidentification, mean any interpretation can only be tentative.
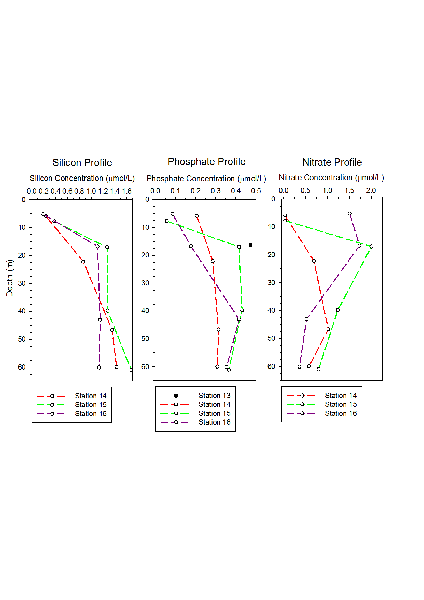
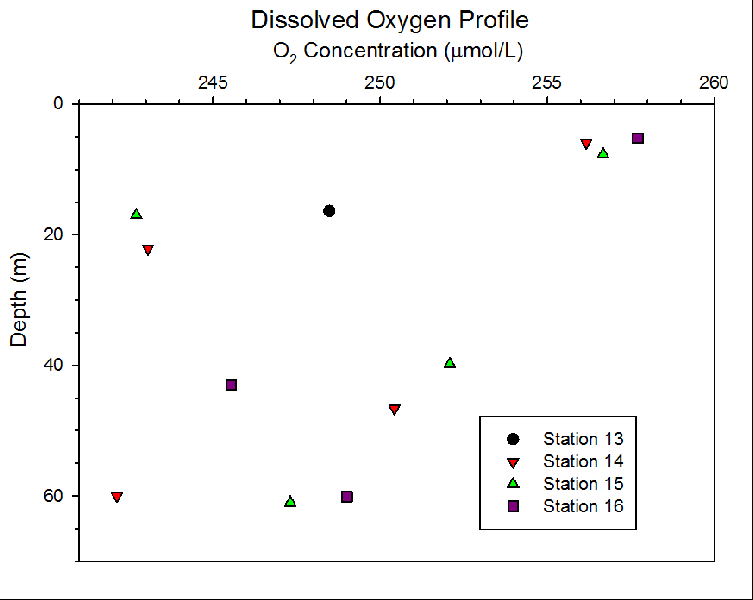
Nutrients were depleted at the surface and limited further phytoplankton growth (Tilman et al., 1982). This indicates that a phytoplankton bloom has occurred. Phosphate and nitrate are required by phytoplankton because they are important components of biomolecules, such as deoxyribose nucleic acid. Diatoms, which were the only phytoplankton group observed, take up silicon for the formation of frustules (Martin-Jézéquel et al., 2000). Dissolved oxygen was high at the surface due to atmospheric exchange and decreased with depth as a result of respiration.
There were a number of complications with the sampling aboard RV Callista. For example, the working group attempted to sample three depth ranges for zooplankton at Station 16 (0-14m, 14-22m and 22-28m). Failure to trigger net closure meant the desired depth range was not sampled. However, a sample from 22 m to the surface was still collected. This can be compared to the 0-14 m sample to determine which zooplankton groups were unique to the 14-22 m band. Furthermore, the phytoplankton analysis was limited because a large amount of data was lost due to human error.
- Tett, P. (1990) The photic zone. Light and Life in the Sea (ed. by P.J. Herring, A.K. Campbell, M. Whitfield & L. Maddock), pp. 59-87. Cambridge University Press, Cambridge, UK.
- Martin-Jézéquel, V., Hildebrand, M. & Brzezinski, M.A. (2000) Silicon metabolism in diatoms: implications for growth. Journal of phycology, 36.5, 821-840.
- Tilman, D., Kilman, S.S. & Kilman, P. (1982) Phytoplankton community ecology: the role of limiting nutrients. Annual Review of Ecology and Systematics, 13.1, 349-372.
- Pegau, W.S., Gray, D. & Zaneveld, J.R.V. (1997). Absorption and attenuation of visible and near-infrared light in water: dependence on temperature and salinity. Applied optics, 36.24, 6035-6046.
- Miller, C.B. (2004) 8. Population biology of zooplankton. Biological Oceanography (ed. by C.B. Miller), pp. 158-180. Wiley-Blackwell, Hoboken, New Jersey, USA.
- Galperin, B., Sukoriansky, S., Anderson, P.S. 2007, ‘On the critical Richardson number in stably stratified turbulence’, Atmospheric Science Letters, 8, 65-69.
A range of biological, chemical and physical properties were measured. Analysis has revealed that the water column offshore of Falmouth was thermally stratified at the time of sampling. The upper 20 m of the water column were, typically, 2-4 °C warmer than at depth. There is evidence that a surface diatom bloom has occurred in the recent past. Furthermore, a sub-surface chlorophyll maximum existed at the thermocline, approximately 20 m water depth.
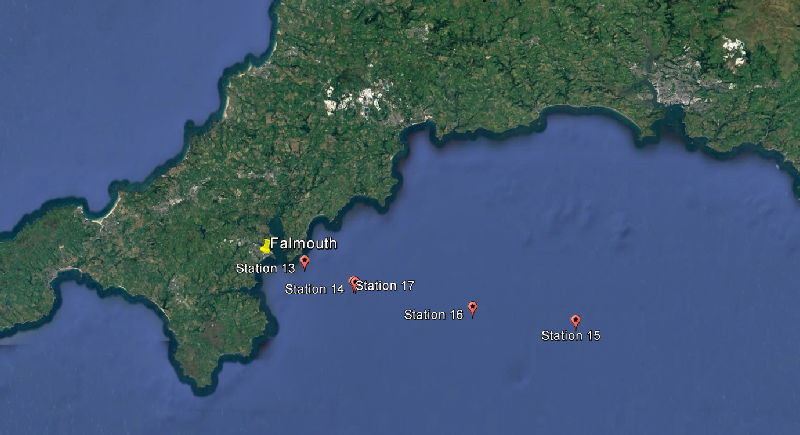
Figure 22: map of offshore sites visited around Falmouth
(Click Picture To Enlarge)
Density
Figure 29 shows that density increased with depth at all of the locations sampled. Density ranged from approximately 1025.8 kg m-3 at the surface to 1027.2 kg m-3 near to the seabed. Station 13, where surface density was greater than at other sites, was the exception to this pattern.
Dissolved Oxygen Concentration
The changes in dissolved oxygen concentration with depth are displayed in Figure 28. Stations 14 and 15 exhibited a similar trend in dissolved oxygen concentration. There was a decline between the surface and 20 m water depth, an increase between 20 m and approximately 45 m followed by a decline until 60 m. Dissolved oxygen at Station 16 declined from 258 μmol/L at the surface to 246 μmol/L at 40 m. There was a subsequent increase to 250 μmol/L at 60 m. The data point from Station 16 at 20 m water depth was removed because it was deemed to be anomalously high and the result of some form of sampling error.
Temperature
The temperature profiles of the five stations surveyed are displayed in Figure 27. All sites experienced a rapid decline in temperature from approximately 16 °C near to the surface to 12 °C at 20 m water depth. After this point, the water temperature was relatively constant. The water column at Station 13 was cooler at the surface and warmer at depth compared to the other stations.
Nutrient Concentrations:
The concentrations of the three nutrients - silicon, phosphate and nitrate - generally, increased between the surface and 20 m water depth at all three stations where nutrient samples were collected (Figure 26). After this point, nutrient concentrations remained relatively constant with depth. The exception to this pattern was nitrate, which decreased with further increases in depth.
PAR (Photosynthetically Active Radiation)
Photosynthetically active radiation (PAR) decreased exponentially with depth at all five sampling stations (Figure 25). PAR at the surface of Station 16 was significantly higher than at other sites and exceeded 3250 V.
Transmission
The changes in transmission with depth are described in Figure 24. There was, generally, a thin band of significantly reduced transmission at approximately 20 m water depth. This feature was most prominent at Stations 15 and 16, the two most offshore sites, where transmission decreased to approximately 3.9 V and 3.75 V respectively over several metres. Furthermore, below this band, transmission was greater at Stations 15 and 16 compared to the other three survey sites.
Fluorescence
Figure 23 details the fluorescence profiles for each of the five sampling stations. Fluorescence increased rapidly over approximately five metres of the water column to reach a maximum at 20 m water depth. Similarly to transmission, this feature was most prominent at Stations 15 and 16, where fluorescence reached 3.5 V and 5.8 V respectively. Fluorescence at greater depths is relatively constant and higher than at the surface.
(Click Picture To Enlarge)
(Click Picture To Enlarge)
(Click Picture To Enlarge)
(Click Picture To Enlarge)
(Click Picture To Enlarge)
(Click Picture To Enlarge)
(Click Picture To Enlarge)
Figure 23: the change in fluorescence (µg/m³) with depth at stations 13-17. Fluorescence has been calibrated against chlorophyll concentrations.
Figure 24: transmission (%) of stations 13-16 plotted against their respective depths.
Figure 25: chlorophyll concentrations (µmol/L) found at stations 13-16 plotted against their respective depths.
Figure 26: measured concentrations of silicon, phosphate and nitrate (µmol/L) found at stations 13-16 plotted against their respective depths.
Figure 27: temperature (°c) measured at stations 13-16 plotted against their respective depths.
Figure 28: dissolved oxygen concentrations (µmol/L) found at stations 13-16 plotted against their respective depths.
Figure 29: density (kgm-³) calculated for stations 13-17 plotted against their respective depths.
Figure 30a: predicted abundances of different zooplankton in a 1m³ sample at station 14 between 28 and 22 meter depths
Figure 30b: predicted abundances of different zooplankton in a 1m³ sample at station 15 between 28 and 22 meter depths.
Figure 30c: predicted abundances of different zooplankton in a 1m³ sample at station 16 between 22m depths and the surface
Figure 30d: predicted abundances of different zooplankton in a 1m³ sample at station 16 between 28 and 22 meter depths
Zooplankton
The composition of the zooplankton community from two depth ranges (0-22 m and 22-28 m) at Station 16 is detailed in Figure 30c and Figure 30d respectively. The majority of the zooplankton found in the shallower depth range were Ctenophora spp. (810 m-3). Copepoda spp. made an important contribution to this community (394 m-3 or 463 m-3 if nauplii are considered). Zooplankton were more abundant in the deeper depth range (Figure 30d). In contrast to Figure 30c, Ctenophora were not observed in the deeper sample and, instead, the community was dominated by Copepoda spp. (3480 m-3). Furthermore, hydromedusae were the second most abundant zooplankton type and were found in higher numbers than the most prevalent group in the shallower sample (1613 m-3). The zooplankton community over the same depth range at Station 15 is similar to that of Station 16, in that Copepoda spp. and hydromedusae are dominant.
The zooplankton community at Station 14, taken between 22-28 m (Figure 30a), was more diverse than that of Station 16 (Figure 30d). Copepoda spp. are, similarly, the most abundant zooplankton group (1494 m-3). However, groups, other than hydromedusae, were found in large numbers, for example Cladocera (781 m-3) and multiple larval forms.
Phytoplankton
Figure 31 shows the amount of phytoplankton (ml-1). The highest phytoplankton concentrations were found at station 16 at a depth of 16.7m. This depth corresponds to the depth at which the CTD recorded a fluorescence peak. There was a greater diversity of phytoplankton groups at this location. Phytoplankton concentrations from station 16 at a depth of 5.2 metres were smaller than at 16.7m.
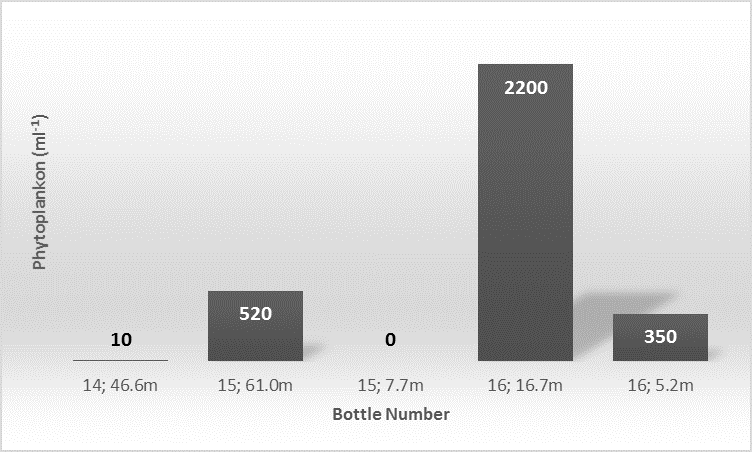
Figure 31: abundance of different phytoplankton in a 1m³ sample.
Bottle 11
Station: 14
Depth: 46.6m
Species: Pseudo-nitzschia delicatissima
Bottle 10
Station: 15
Depth: 61.0m
Species: Meuniera, Coscinodiscus, Pseudo-nitzschia
delicatissima, Chaetoceros
Bottle 6
Station: 15
Depth: 7.7
Species: none
Bottle 28
Station: 16
Depth: 16.7
Species: Meuniera, Pseudo-nitzschia delicatissima,
Chaetoceros, Coscinodiscus
Bottle 34
Station: 16
Depth: 5.2
Species: Pseudo-nitzschia delicatissima, Chaetoceros
socialis.
Richardson Number
The Richardson number was calculated at each station. This was done by measuring the flow at each station. This was then put into a worksheet where the density for each depth was calculated and then entered into the Richardson equation (figure 32). The Richardson number was then plotted against depth at 0.5m intervals. The Richardson number gives an idea about the extent of stratification in a water body. A value higher than 0.25 indicates that a stable water column. A lower value indicates that increased velocity shear will tend to overturn the water column (Anderson et al, 2007).
Figure 32: Richardson number formula, where:
g = acceleration due to gravity (m/s²)
Rho = mean density (kg/m³)
Rho1 = density of upper water parcel (kg/m³)
Rho2 = density of lower water parcel (kg/m³)
h = depth (m)
u = velocity (m/s)
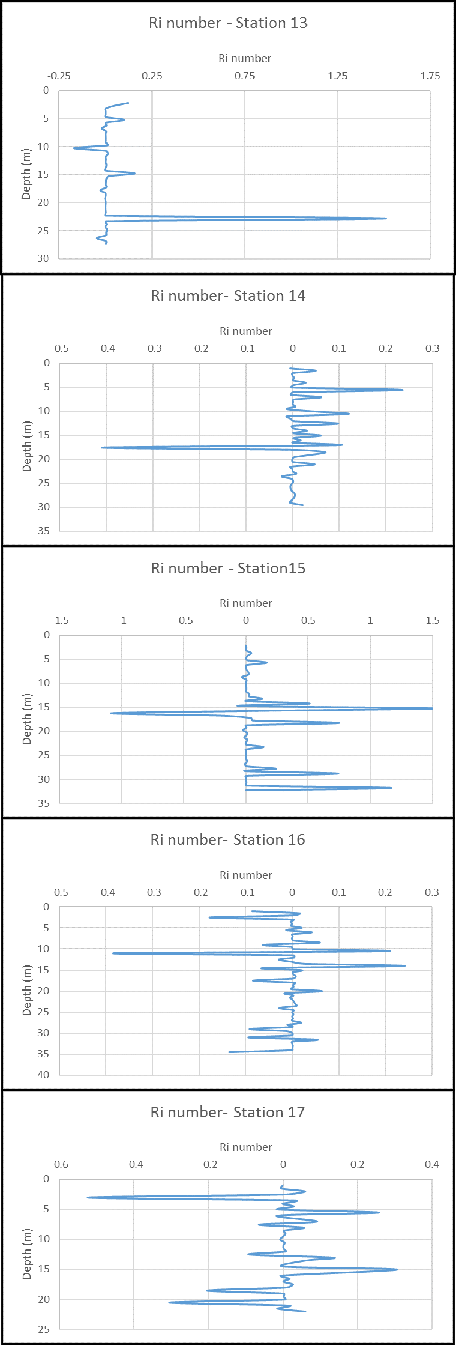
Figure 33:
Station 13: Here we have values lower than 0.25 and so we would expect mixing to occur. There is one point at which the Richardson number becomes greater than 0.25 but it is a single point and therefore will not affect the water body as a whole.
Figure 34:
Station 14: Richardson number is often greater than 0.25 indicating the water column is stable.
Figure 35:
Station 15: Station 15 has a large range of values. Most points lie below 0.25 and this is indicative that mixing will occur. There are a few points at which the water is stable and stratified, but these are few and widespread.
Figure 36:
Station 16: Richardson number fluctuates between positive and negative values.
Figure 37:
Station 17: Large range in Richardson number from -0.52 to 0.31.