
Falmouth 2015 Group 10
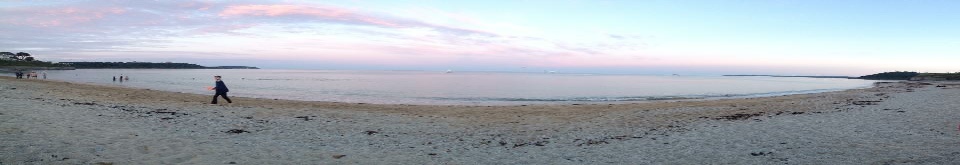
The Fal Estuary is home to a diverse range of benthic habitats, and due to historical disturbances to the biodiversity of the area, much of the Fal estuary is now classed as a Special Area of Conservation (SAC).
The aim of the survey was to establish distinct habitat zones in an area surrounding and including the maerl beds, and be able to identify other habitats at this location. This was accomplished by using sonar to create a side-scan of the seafloor to determine the zonation, then deploying video recording apparatus to ground-truth the zones and thereby the distinguish the different habitats present in the zones.
The original plan was to carry out 6 transects between Carrick Roads and St Mawes Point. Unfortunately we had to revise this plan to only 4 transects as the first was too near to the bank, where tidal influences and shallow water limited us to deeper water. The last transect was also abandoned due to time constraints. However, the four middle transects gave us sufficient coverage of the sample area to carry out habitat mapping.
Date: 24-06-2015
Time: 11:45 - 14:40 UTC
High Water: 10:08 UTC
Low Water:
Tidal Range: 2.5m (neap)
Location: Between 33278.7m N, 183628.8m E and 33362.4m N, 18333.8m E (northings and eastings)
Sea State: Fairly Calm
Average Wind: 10 Knots
Prevailing Wind: Southerly
Cloud Coverage: 7/8th
Vessel: Xplorer
- Habitat mapping was undertaken after choosing a location between Carrick Roads and St. Mawes Point.
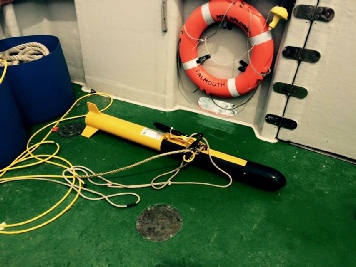
- The surveying techniques used were deployed from the MTS Xplorer vessel and included: a sidescan sonar backscatter array, in the form of a towfish, as well as an underwater video camera.
- Firstly, the towfish was deployed across 5 transects, parallel at 100 metres apart using a swath width of 150m.
- The sonar readings highlighted several areas of interest (notable habitat zones or unusual objects) which were then revisited with the camera.
- The video camera was used as a ground-truthing method in which we recorded a video of the sea-floor at the highlighted areas on interest.
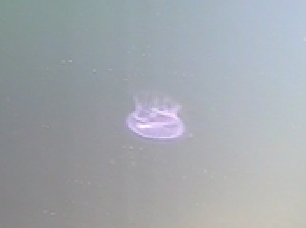
Aurelia aurita (Moon Jelly), found as camera was descended at station 1. Several other Cnidaria were identified from the boat however this was the only sighting of Aurelia aurita.
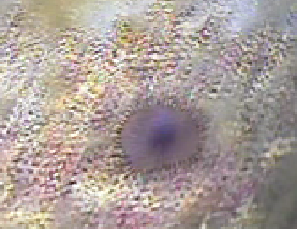
Myxicola infundibulum (Filter feeding Annelid), found amongst the Maerl beds of station 1. Mostly solitary in station 1, seemingly unaffected by the uncommon substrate.
Myxicola infundibulum (Filter feeding Annelid), seen after retracting its plume upon disturbance from the camera. Found at the most diverse site, station 2.
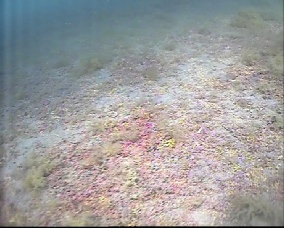
A view of the Maerl bed at station 1. This environment hosted a large diversity of fauna as well as algae growing on top of the Maerl. According to the skipper, there was less benthic algae present than last year. This was the shallowest site, which may explain the higher diversity of primary producers.
Turritella communis (Auger Shell), pictured at station 2 and also sighted at station 3. These were present in areas of both high and low diversity with varying depths and incline.
The tow-fish used to create a side-scan sonar image of the sea floor
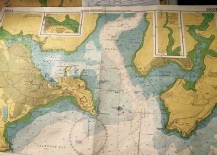
Our chosen transects for habitat mapping, 11-14, at Carrick Roads. (Click to enlarge)
Site 1- Rare maerl beds. Medium wave action creating perfect conditions for maerl habitats.
Site 2- Rocky Reef Outcrops.
SIDE SCAN SONAR and VIDEO GROUND-TRUTHING
Side scan sonar uses acoustics to create an ‘image’ of the sea floor by sending a sound pulse and measuring the backscatter. Hard substrates such as rocks have a stronger return signal, showing as dark areas, and softer substrates with weaker return signals show as lighter areas. Features that are above the sea floor or protrude above it will cast shadows in the sonar image where the sound pulse has not hit. It is a useful tool in habitat mapping, as it allows for identification of different bed types and therefore different habitats by analysing the side scan image. Side-scan sonar does however have its limitations, as we cannot visualise the habitats identified. To further analyse the backscatter, video ground-truthing was required.
The combination of both the side-scan sonar and video provided optical as well as acoustic data for the area of study. The underwater camera operated at a smaller scale than the side-scan sonar, but provided footage of the benthic community, their activity and the habitat they inhibit. The use of a camera allows for identification of the species, and also provides an indication of their abundance and distribution.
On top of this, optical methods provide information about the evolution and changes occurring over time in the area of study. For example, the skipper noted that there was much less algae present on top of the Maerl beds than in previous years. This observation could not have been noted with the side-scan sonar alone.
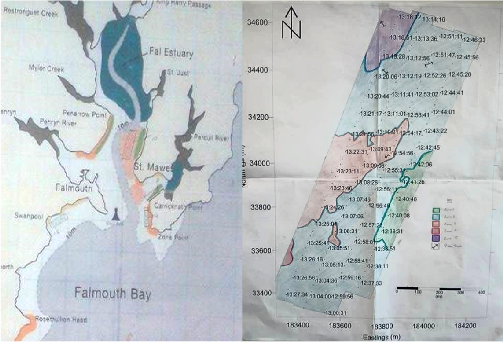
Left: A map of the area we studied.
Right: Sediment type and morphology, interpreted from a sides-can sonar trace.
(Click to enlarge)
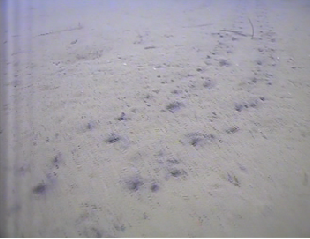
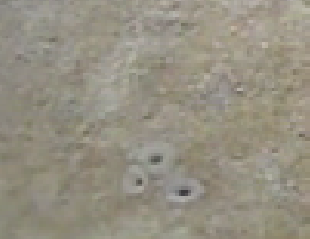
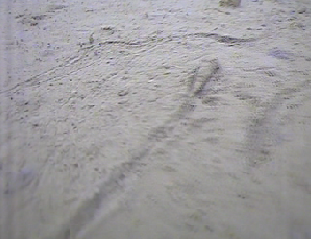
A peculiar perturbation on the seabed at station 3. Two rows of holes heading towards a structure, presumably left by a megafaunal Arthropod (possibly Haras araneus the common spider crab).
Site 3- Muddy Habitat.
1. Blunden, G; Campbell, S.A; Smith, J.R; Guiry, M.D; Hession, C.C and Griffin R.L (1997)C hemical and physical characterization of calcified red algal deposits known as maerl. Journal of Applied Phycology 9 11-17.
2. Grall, J. and Hall-Spencer J.M. (2003) Problems facing maerl conservation in Brittany. Journal of Aquatic Conservation: Marine and Freshwater Ecosystems 13 55-64. [Online] Available at: http://www.ukmpasd.org/pdf/Grall_Hall-Spencer_200.pdf Last accessed 25/06/15
3. Kamenos, N.A; Moore, P.G, and Hall-Spencer J.M (2004) Nursery-area function of maerl grounds for juvenile queen scallops Aequipecten opercularis and other invertebrates. Journal of Marine Ecology Progress Series 274, 183-189.
4. Cochrane, G. R. & Lafferty, K. D., 2002. Use of acoustic classification of sidescan sonar data for mapping benthic habitat in the Northern Channel Islands, California. Continental Shelf Research, 22(1), pp. 683-690.
5. National Oceanic and Atmospheric Administration, 2008. Side Scan Sonar. [Online]
Available at: http://oceanservice.noaa.gov/education/seafloor-mapping/how_sidescansonar.html
[Accessed
29 June 2015].

The views on this website are solely those of Group 10, and are in no way affiliated with the views of University of Southampton or the National Oceanography Centre.
 BACK TO TOP
| Introduction |
| Metadata |
| Biological |
| Chemical |
| Physical |
| References |
| Introduction |
| Metadata |
| Biological |
| Chemical |
| Physical |
| References |
| Introduction |
| Metadata |
| YSI |
| Flowmeter |
| Chlorophyll a |
| Irradiance |
| References |
| Introduction |
| Metadata |
| Methods |
| Sidescan |
| Video Ground-Truthing |
| Poster |
| References |