
Falmouth 2015 Group 10
Date: 30-06-2015
Time: 08:30 UTC
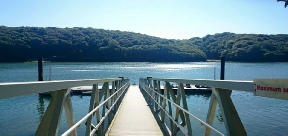
Location: King Harry’s Ferry Pontoon
High Water: 15:55 UTC
Low Water: 22:00 UTC
Tidal Range: 3.6m
Sea State: Calm (0)
Average Wind: 16 Knots
Prevailing Wind: South easterly
Cloud Coverage: 1/8th
Vessel: None (Working from pontoon)
On the 30th June, group 10 surveyed from a pontoon located just north of King Harry’s Ferry (50° 13' 0.742N, 5° 1' 43.66W) where both riverine and marine inputs influence.
This was an excellent position for recording how mid-estuarine conditions change over the semi-diurnal tide, and equipment can be deployed easily and safely into the water.
As it is a stationary point, a time-series can be used to determine changes in the water column over the day. This was done between 08:30 –11:30 UTC by group 10 and then continued by group 12 until 15:00 UTC. This time series can then be analysed to determine how the riverine and marine forces interact at a fixed point, and the possible biological and chemical interactions(1), (2).
To view summary of methods undertaken on the pontoon, please click HERE.
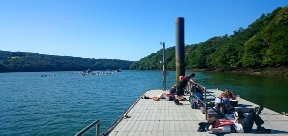
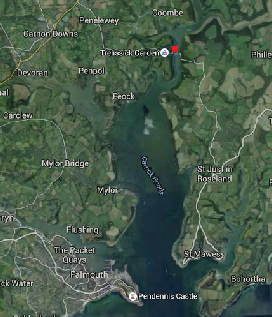
Location of King Henry’s Pontoon shown by the red dot. (Hover mouse over image to enlarge)
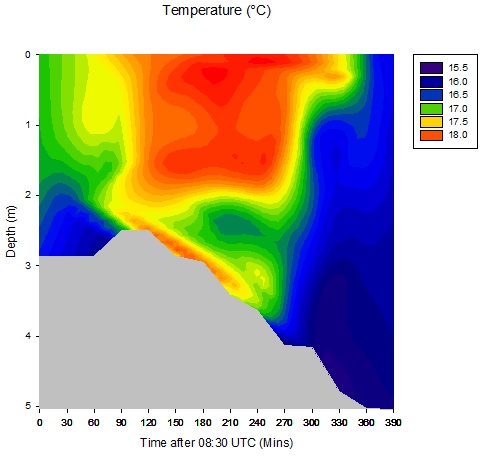
Temperature
Temperature measurements at the pontoon show slight variation throughout the day. This increases towards midday (210 minutes) resulting in peak surface temperatures of around 18°C, with a significant dip after 14:00 (360 min) to a minimum surface temperature of 16.5°C. This may coincide with a change in tide, as high water was at 15:55. The change in temperature would suggest that the marine member is colder than the riverine.
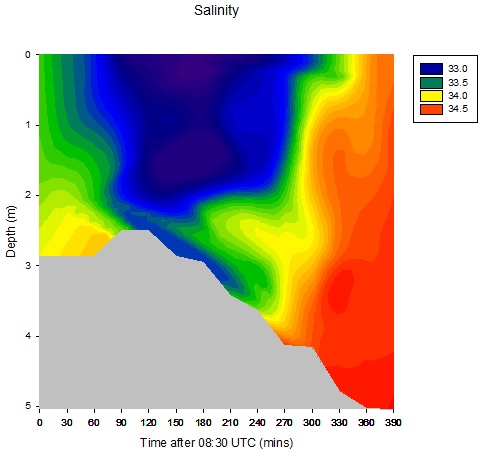
Salinity
Noticeable salinity changes occur over the period of a day at the pontoon. The fresh water inputs are strongest on an outgoing tide, this is shown between 10 (90 minutes past 8:30) and 12:30 (240 minutes) as minimum salinity readings are reached (33 PSU at intermediate depths). However as the tide turns, tidal inputs dominate the flow and salinity increases. This is shown from 13:00 (270 minutes) onwards. The figure also shows a suspected salt wedge occurring with the incoming tide. Maximum salinity was 34.5 PSU at approximately 3.5 metres.
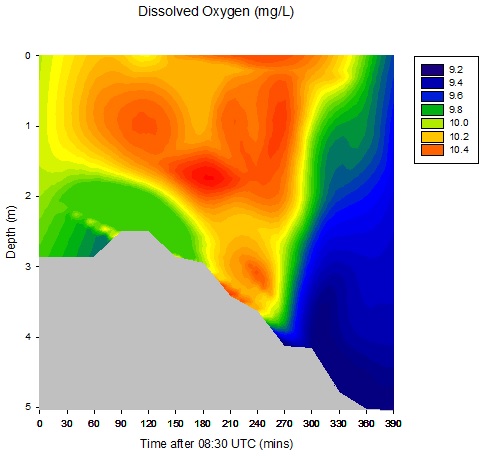
Dissolved oxygen
Dissolved oxygen concentrations undergo very minor changes throughout the day. The range is from 10.4 mg/L at 11:30 (180 minutes) down to 9.2 in the deepest point of the estuary at 13:30 to 14:00. This slight change is possibly due to the reduction in nutrient inputs as tidal forces begin to dominate and the nutrient-rich riverine inputs are supressed.
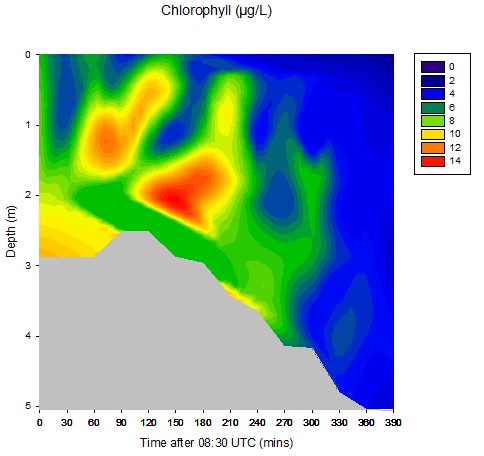
Chlorophyll
Chlorophyll concentrations fluctuate substantially throughout the day. The range is between 14 to 2µg per litre. Highest concentrations are observed around 11:00 (150 minutes) at intermediate depths. Towards the end of the day, chlorophyll concentrations drop off to around 4µg per litre. This may be in part due to the volume fluctuations occurring in the riverine basin as the tide changes. With the rising tide, the volume increases but the amount of cells remain relatively stable, thus chlorophyll concentrations are diluted. Chlorophyll concentration can be used as a proxy for phytoplankton. The slack water conditions at low tide allow more phytoplankton to accumulate, before the flushing period distributes them elsewhere. The current location of the maximum turbidity zone, which alters with the tides, can also affect the movement and resuspension of the phytoplankton (3).
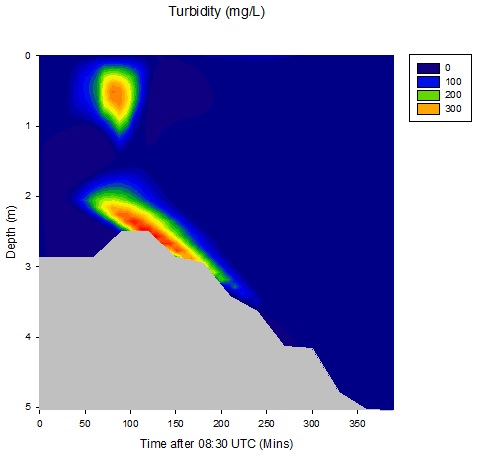
Turbidity
Two main disturbance events occurred during the day at the pontoon. The first was at around 10:00 (90 minutes) near the surface. The second began around the same time, ended at 11:30 (180 minutes) and remained close to the riverbed. The origin of these turbid events is difficult to say, however the first may have been due to a ferry docking at the pontoon, which could have disturbed the sediment. The second turbid event may have been due to a layer of plant material on and around the seabed.
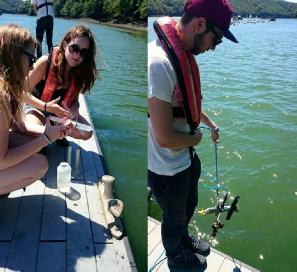
A YSI probe was lowered into the water at 30 minute intervals between 08:30 and 11:00 (UTC) and various components of the water column were measured at every metre from the floor of the estuary. The following graphs and explanations summarise the initial findings.
A flowmeter was lowered into the water at 30 minute intervals between 08:30 and 10:30 (UTC) to measure the velocity and direction of flow, which enabled us to determine how the flow changes in that location during the tidal cycle. The following graphs and explanations summarise the initial findings.
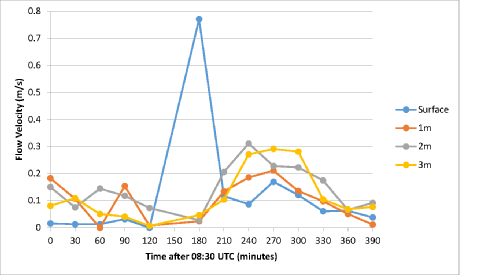
At all depths, minimum velocity occurs at 120 minutes after 08:30 (10:30). Here the highest flow, as at most survey times, is at 2m depth and is 0.073ms-1. This can be considered to be slack water, occurring 30 minutes after Falmouth’s low water, due to the distance the tidal wave must travel up the estuary before reaching the pontoon.
Flow velocity throughout the water column then increases after 10:30, to a maximum of 0.311ms-1 at 240 minutes (12:30) at 2m depth, ignoring the anomaly at 180 minutes (11:30) in the surface data.
This begins to decrease as high water approaches, to a second minimum within the data set at 390 minutes (15:00). Here, the lowest flow is 1m below the surface, at 0.012 ms-1.
This indicates that a constant process of tidal stirring is occurring within the Fal Estuary, which is known to be important to phytoplankton blooms (4).
It is also important to note that the direction of flow reverses between 10:00 and 10:30 (UTC), from south east (~170°) at 08:30 UTC, to north west (~340°) at 10:30 UTC. This coincides with low water occurring at 10:00 UTC and the fact that the survey took place during ebb tide prior to 10:00 and flood tide after.
Change in flow velocity at the pontoon location across the tidal cycle at each depth below the surface (as shown in figure legend).
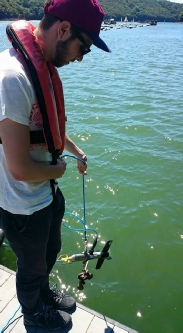
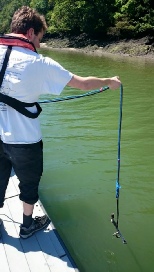
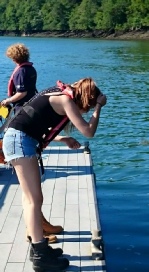
Deployment of the flow meter from the pontoon.
Chlorophyll samples were taken from the surface of the water at 30 minute intervals between 08:30 and 11:00 (UTC). These samples were analysed in the lab the following day, and were found to agree with the YSI probe data. In lieu of this, graphs have not been included due to the YSI probe having collected the same data at various depths including the surface.
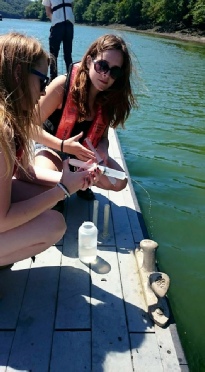
Filtering water samples through filters to collect chlorophyll from the water, to be later analysed in a lab.
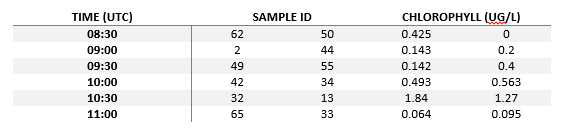
Table of chlorophyll measurements over time after lab analysis. Click to enlarge.
A light meter was lowered into the water at 30 minute intervals between 08:30 and 11:00 (UTC) to measure the light intensity change with depth over a tidal cycle in the upper estuary. The following graph shows a time series of light intensity variation with depth. Note the hashed area is the floor of the estuary.
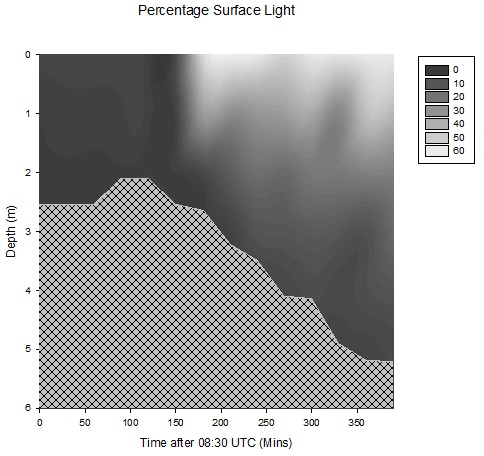
Irradiance at all depths increases throughout the day, with a large change after 150 minutes (). This change is due to a handover from Group 10 to Group 6 and the consequential alteration in methodology.
The gradual increase from 210 minutes (12:00) onward is likely due to the incoming High Water. With a higher water level, there is reduced turbidity as the instrument is comparatively further from the bottom, and thus the source of suspended sediment, than earlier in the day.
However a slight reduction in irradiance occurs at 1m and 2m from the surface occurs at 240 minutes (12:30). This is possibly due to the increase in flow velocity here (see figure) causing a greater level of resuspension.
Click image to enlarge.
1. Sharples, J., & Simpson, J. H. (1995). Semi-diurnal and longer period stability cycles in the Liverpool Bay region of freshwater influence. Continental Shelf Research, 15(2), 295-313.
2. Attrill, M. J., & Rundle, S. D. (2002). Ecotone or ecocline: ecological boundaries in estuaries. Estuarine, Coastal and Shelf Science, 55(6), 929-936.
3. Irigoien, X., & Castel, J. (1997). Light limitation and distribution of chlorophyll pigments in a highly turbid estuary: the Gironde (SW France). Estuarine, Coastal and Shelf Science, 44(4), 507-517.
4. Cloern, J. E. (1991). Tidal stirring and phytoplankton bloom dynamics in an estuary. Journal of marine research, 49(1), 203-221.

The views on this website are solely those of Group 10, and are in no way affiliated with the views of University of Southampton or the National Oceanography Centre.
 BACK TO TOP
| Introduction |
| Metadata |
| Biological |
| Chemical |
| Physical |
| References |
| Introduction |
| Metadata |
| Biological |
| Chemical |
| Physical |
| References |
| Introduction |
| Metadata |
| YSI |
| Flowmeter |
| Chlorophyll a |
| Irradiance |
| References |
| Introduction |
| Metadata |
| Methods |
| Sidescan |
| Video Ground-Truthing |
| Poster |
| References |