
Falmouth 2015 Group 10
Offshore surveying of the Western English Channel was conducted on the 30th June 2015 from RV Callista. Group 10 planned to sample the seasonal front in a southwest direction. Mixing processes are powerful further offshore from Falmouth, where strong southerly winds and a lack of shelter rapidly diminish riverine characteristics of the water column.
The planned aim of the survey was to measure the physical, chemical and biological properties of the tidal front around Station 2 (50 005.734N, 004 52.694W). However, due to prevailing weather conditions on the day, this plan was unattainable. A strong south-easterly wind produced high swells in the afternoon, meaning that it was only safe to sample out to Station 1 (coordinates?). We sampled this station as a ‘jig-down’ to see how feasible this area was, yet decided to stay relatively inland as it proved impractical to sample further out due to sickness within the team.
A new aim was therefore designed, to compare the vertical profiles of the mouths of the local estuaries, the Fal and the Helford. The Helford river is less studied than the Fal, but is still designated as a Special Area of Conservation (SAC), home to maerl beds and cold-water reefs (1), as well as being the site of discovery of Couch’s Goby (2).
Alongside CTD data, ADCP transects were collected to compare the transport of the estuaries, as well as plankton samples to compare the biota.
To view the methods of sampling and analysis click HERE.
Date: 30-06-2015
Time: 12:54 UTC
Location: Various
High Water: 15:55 UTC
Low Water: 22:00 UTC
Tidal Range: 3.6m
Sea State: Roughest offshore (4)
Average Wind: 25 Knots
Prevailing Wind: South easterly
Cloud Coverage: 1/8th
Vessel: RV Callista
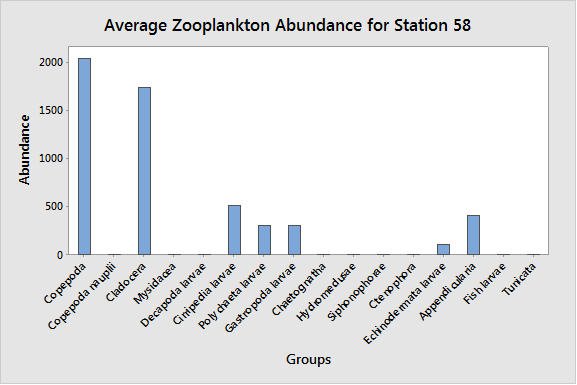
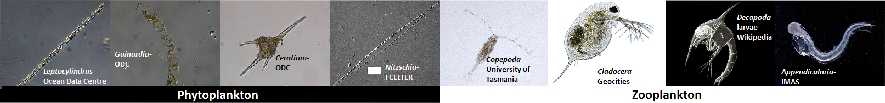
The following graphs show the differences in phytoplankton and zooplankton community structure between locations both offshore and in the mouths of estuaries around Falmouth.
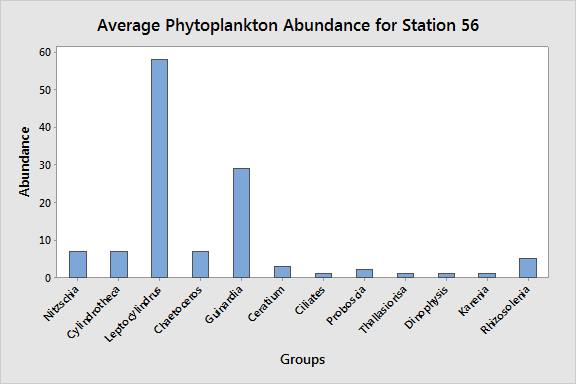
The sample from station 56 contained 12 species of phytoplankton present within it, the most abundant of which were Leptocylindrus, followed by Guinardia. All other species averaged less than ten members throughout the water column. At a depth of 12.8m, Leptocylindrus dominated the phytoplankton community, with 80 of 127 individuals identified within the sample. Leptocylindrus was also most abundant at the shallower depth (7.6m), though the total population size was smaller (Leptocylindrus made up 19 of 27 individuals in the sample). At depth (26.1m), numbers of Guindara and Leptocylindrius were roughly even. Together these species made up most of the community structure. This depth is also the only depth where Rhizosolenia were present.
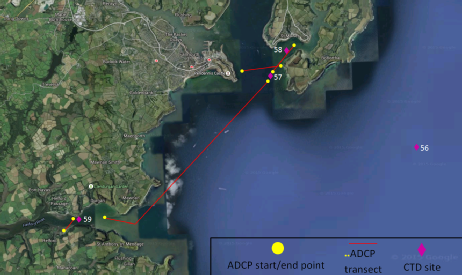
Google maps satellite view showing locations of ADCP transects and CTD drops around Falmouth Bay. (Hover mouse over image to enlarge)
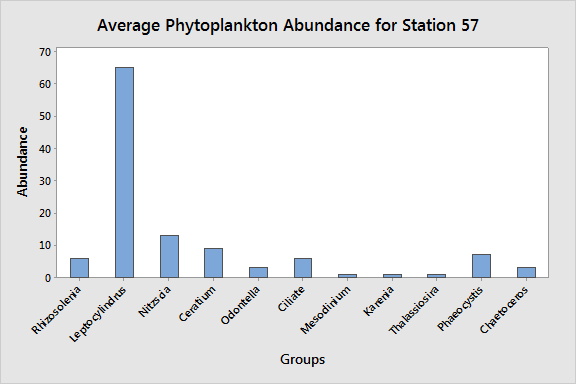
Leptocylindrus were also the most abundant at station 57, with more considerably individuals present within the sample at both depths than all other phytoplankton species identified (11 in total). Many more individuals were present at 28m (194 individuals) than at 2m (35 individuals).
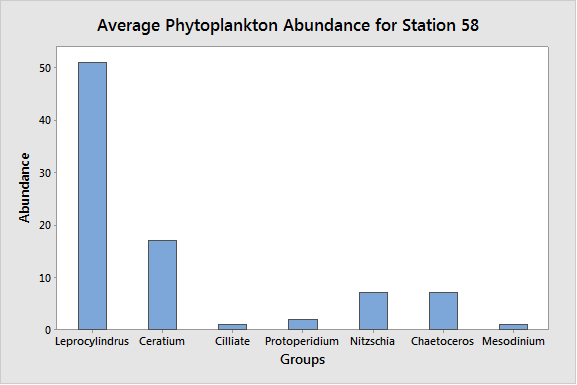
Station 58 contained fewer species than the other stations (7 identified). Leptocylindrus was still the most abundant species present within the water column, however at depth there was nearly as many Ceratium as Leptocylindrus (14 Ceratium to 16 Leptocylindrus).
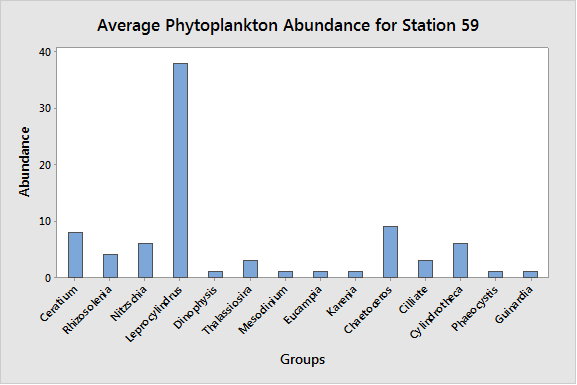
Leptocylindrus also dominated the phytoplankton community at station 59, especially in the deeper water (5.54m). However at a depth of 1.8m, the amount of Nitzschia, Leptocylindrus, Chaetoceros and Cylindrotheca were much closer (10, 15, 12, 11 respectively out of 53). Ceratium at this station were only present near the surface, while at station 58 they appeared to be quite abundant at depth.
While most coastal species of phytoplankton are capable of tolerating salinities well below those of their usual range (3), it appears that the marine-adapted Leptocynlindrus is increasingly challenged in more riverine waters.
Communities at depth were consistently higher in individuals and biodiversity, indicating that less stress (almost certainly caused by nutrient limitation) was occurring. In addition, non-measured variables, such as iron, may be responsible for surface growth limitation (4).
Phytoplankton (click on each image to enlarge or view as slideshow)
Zooplankton (click on each image to enlarge or view as slideshow)
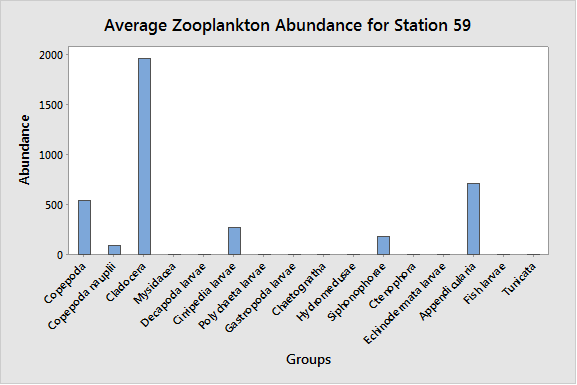
Station 59 was also a shallow site and sampling was also limited by water depth. As before, this means that the data should be representative of the zooplankton population for station 59. Cladocerans (52%) and Appendicularia (19%) were the dominant groups for this station. Station 59 was the least diverse station that was surveyed, with only 6 zooplankton groups represented.
During the survey, certain groups were ubiquitous to all stations (cladocerans, copepods, cirriped larvae and Appendicularia) while some groups were only found in one station (Tunicates, Echinoderm larvae, Decapod larvae and Chaetognaths).
Two groups were completely absent from the survey (Ctenophores, Fish larvae). Certain groups seem to exhibit preferences concerning depth; chaetognaths, hydromedusae and mysidacea were only found between 10 and 15 metres, while echinoderm larvae were only found at the surface. The echinoderms, and other depth-specific larvae, tend to be heavily stratified due to the wide range of mechanisms employed for maintaining their position in coastal waters and eventual settlement (6).
A comprehensive discussion of initial findings from laboratory analysis of water samples collected in situ at all locations and at various depths.
Nutrients
The Helford Estuary (Station 59) and St. Mawes River (Stations 57&58) have largely similar bottom water nutrient concentrations, with silicate measured at 0.52µM at the deepest point of Station 59, and 0.41µM and 0.62µM at Stations 57 & 58 respectively. Phosphate is again comparable at all locations, with measurements of 0.08µM in the Helford, and 0.12µM and 0.11µM in St. Mawes. Nitrate is similar between Stations 58 and 59 (3.72µM and 5.63µM), although Station 57 exhibits a large difference (15.19µM). This is likely due to the addition of nitrate to the water from the Fal estuary. Although similar, the St Mawes stations are consistently higher in nutrient concentration that the Helford, suggesting greater erosional or anthropogenic sources from that river.
Stations 51 and 56 are largely similar, except for the nitrate profile. In this case, the shallow water of Station 51 has a low concentration (3.72µM) compared to the higher surface concentration of Station 56 (14.23µM). This is reversed in the deeper water at both stations, with measurements of 20.93µM and 5.63µM respectively. This is due to Station 56 being inshore, and still maintaining estuarine characteristics. At Station 51, the water is older and its surface has been stripped of nutrients by phytoplankton.
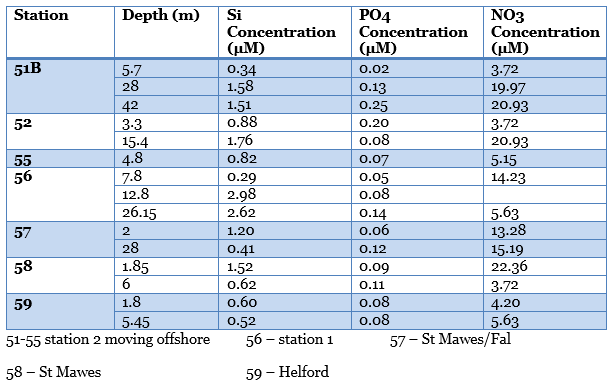
Table of nutrient concentrations at each offshore station, after analysis in the lab. No graphs have been made due to insufficient sampling/links between data sampling stations. Click to enlarge.
Graphs and discussions of initial findings from ADCP, CTD and Secchi disk data collected while on the RV Callista.
ADCP
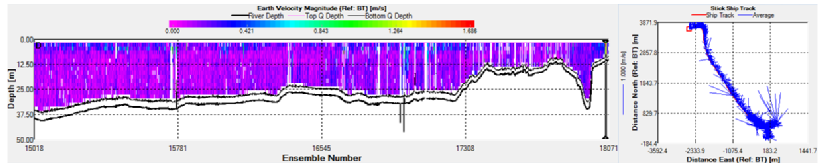
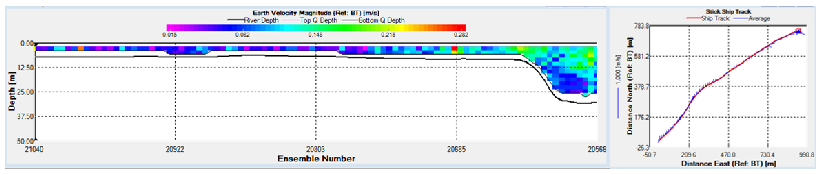
ADCP velocity magnitude profile of the first ADCP transect, with ships track showing direction of flow and route the ship took. To view all ADCP profiles, please click HERE to view a pdf.
12:51. Transect 1 – 50 06.917N 004 58.781W [ 19.2 knots, 99 deg wind]
Transect 1 was an offshore data set about 3 miles into the English Channel. There had been a strong South-Easternly blowing for some time before we took the transect and by the time we surveyed the area the wind speed was 19.2 knots at 99 degrees. This had set up northerly wind-driven waves which are reflected in the ADCP transect. This being an ADCP set taken during a CTD station offshore, the total Q (total volume transport) was very high at over 8000m3/s landward.
The wind forcing caused the surface 6m of the ocean to have a higher velocity than the water column beneath with values ranging from 0.18-0.22 m/s compared to 0.05m/s average beneath. Below 6m depth the water column was fairly uniform and 30-40m depth, so most of the water column experienced fewer frictional forces compared to the water flows in the estuary previously studied.
13:58. Transect 2– 50 08.813N 005 02.118W [ 11 knots 120 deg wind]
The first horizontal transect was conducted along the mouth of the Fal estuary around Black Rock. The natural undredged river channel is only 10-15m deep across most of the channel apart from a deeper 26m scour in the middle of the transect. As we enter the estuary the tide becomes very important, in this case the flooding tide leades to a uniform northernly, landward flow of total 2964.626m3/s.
Perhaps surprisingly the shallower areas of the estuary mouth have a significantly higher current velocity of approx 0.2-0.4 m/s whilst in the main channel with less friction from the seabed, the current is only around 0.15m/s. This could be explained by the fact that as Falmouth is a macrotidal estuary there is a large volume of water moving through the estuary mouth at each tide. In the shallower water the flow is faster because the surface area of the channel is very small. Gravitational forces cause a velocity increase in the water to counteract the small surface area the water is compacted through.
14:13 - Transect 3 – 50 08.805N, 005 01.439W [ 8.4 knot, 91 deg wind]
The second ‘between station’ ADCP dataset was conducted slightly further into the Fal estuary around Black Rock, crossing the mouth of the R. Mawe. This transect focused on the eastern side on the channel near the mouth of the river. What is most striking about the data is the complete contrast in total volume flux compared to previous transects with a total of only 290.851 m3/s landward over the whole transect. The surface waters in the middle of the channel have a faster flow of 0.5 m/s whilst towards the banks the average flow is only 0.15-0.2 m/s. below the surface at 12-25m depth the velocity is uniform at approx. 0.05-0.1 m/s. This could be due to friction from the seabed increasing drag on the current flow.
14:49 – Transect 4 – 50 08.838N, 005 01.405W [ wind 10 knots, 70 deg ]
The second horizontal ADCP transect was conducted travelling in shallow water up into the R.Mawe. The total Q is low with a total of only 310.378 m3/s over the whole transect. The shallow water of only 5m depth with high seabed friction, combined with sluggish flow results in a very confused flow with eddies and small reversed flows. At the start of the transect, near the River Mawe mouth, the flows move landward but in the deeper channel in the North-East of the transect there is a small return flow of 0.1 m/s.
15:05 – Transect 5 – 50 09.298N, 005 00.813W [ wind 15 knots, 83 deg]
This ‘between stations’ dataset was conducted along the banks of the R.Mawe as the river widens into the estuary confluence. This area is exceptionally shallow at only 3-4m depth for almost all of the transect. In this area the flows are variable, the strong friction from the sea-bed causing eddies and ripples that cause inconsistent flow direction. At the North-east end of the transect the water deepens in places to around 5m. In these deeper areas the flow is more uniform at 0.1-0.15m/s. This transect had a higher than average number of bad bin results causing gaps in the data in places.
15:05 – Transect 6 – 50 08.945N, 005 01.325W [ wind 12.7 knots, 100 deg]
This ‘between station’ transect was taken across the whole breadth of Falmouth Bay as we travelled to the Helford River for a river transect. It was conducted as the tide was slightly slowing before the high-tide stand at 15:55. In the data this is evident as across the bay the average flow landward has decreased to only 0-0.1m/s compared to station 45 where average landward flows were as high as 0.25 m/s. Scattered throughout the bay are small areas where water flows exceed 10 m/s. Given this huge difference between this and the uniform flows around it is highly likely that these represent backscatter from small shoals of fish.
15:52 – Transect 7– 50 05.988N, 005 06.950W [ wind 8.4 knots, 48 deg]
This transect was taken across the mouth of the River Helford as it flows into Falmouth Bay. The transect was taken exactly in this shallow channel at the high tide stand at 15:55. From the ship stick track it is clear that there is negligible flow in the centre of the channel and only some residual flows at the river banks with no dominant flow direction. Average flows in the centre of the channel are 0-0.1 m/s whilst at the banks the highest flows are only 0.25m/s Total Q at the high tide is tiny at just 70.5 m3/s ebb.
ADCP velocity magnitude profile of the fourth ADCP transect, with ships track showing direction of flow and route the ship took.
CTD
Salinity, temperature, PAR, oxygen saturation, chlorophyll a concentration and fluorimetry measurements were all collected using the CTD. Click on an image to view a slide show with descriptions and explanations of each figure.
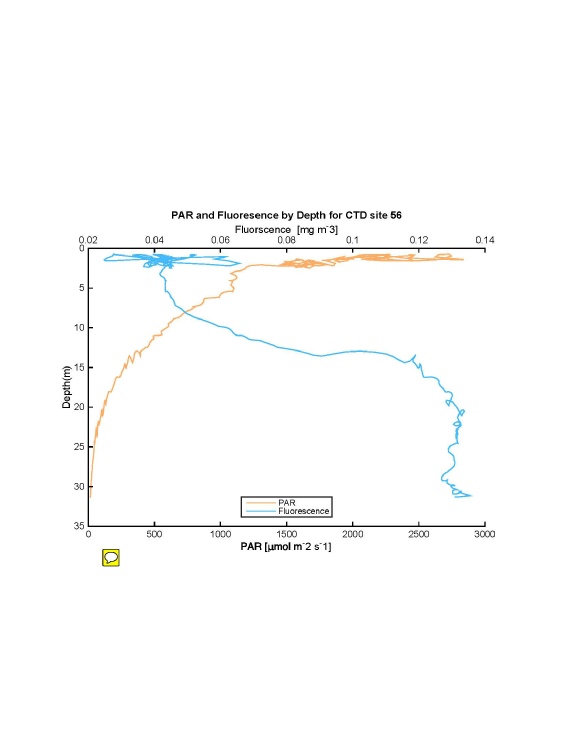
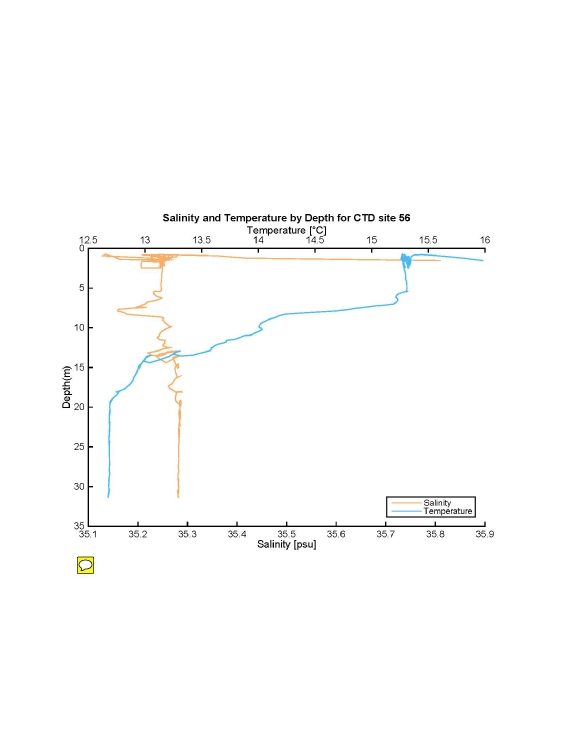
Station 56
Figures 1 and 2: Graphs to show the relationship of PAR, fluorescence, salinity and temperature with depth at station 56 (shakedown station furthest offshore). Click to enlarge and read description.
Station 57
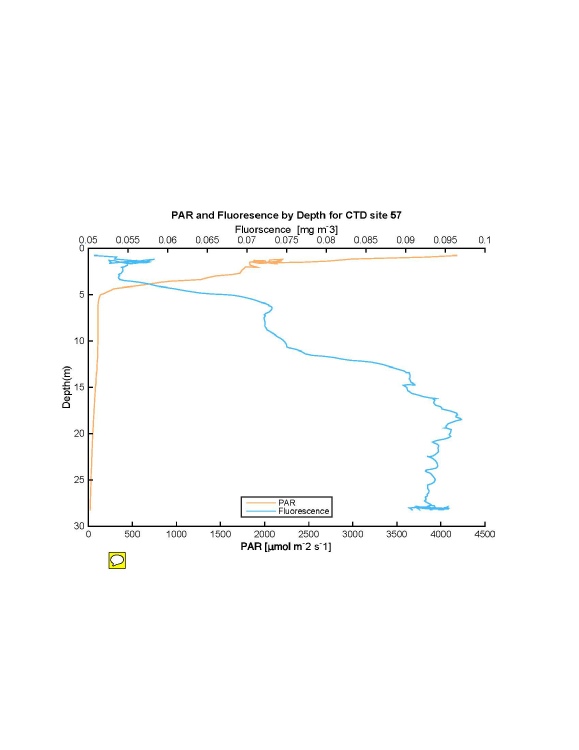
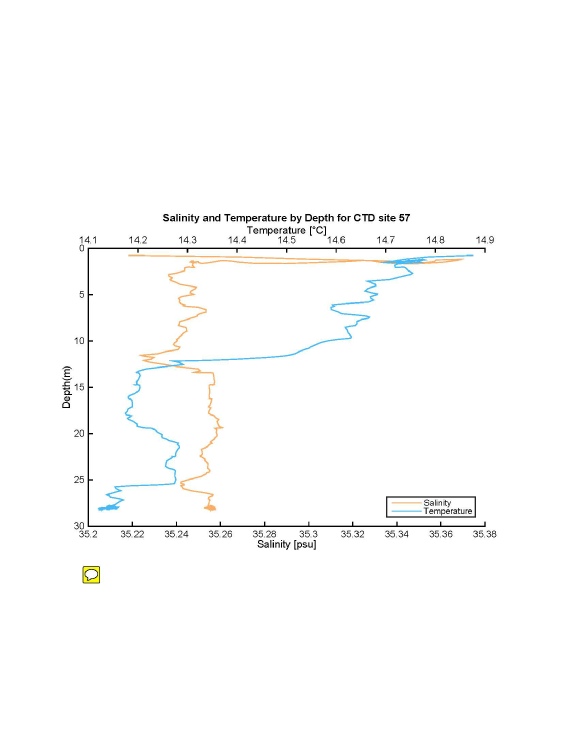
Figures 3 and 4: Graphs to show the relationship of PAR, fluorescence, salinity and temperature with depth at station 57 (Black Rock - mouth of the Fal Estuary). Click to enlarge and read description.
Station 58
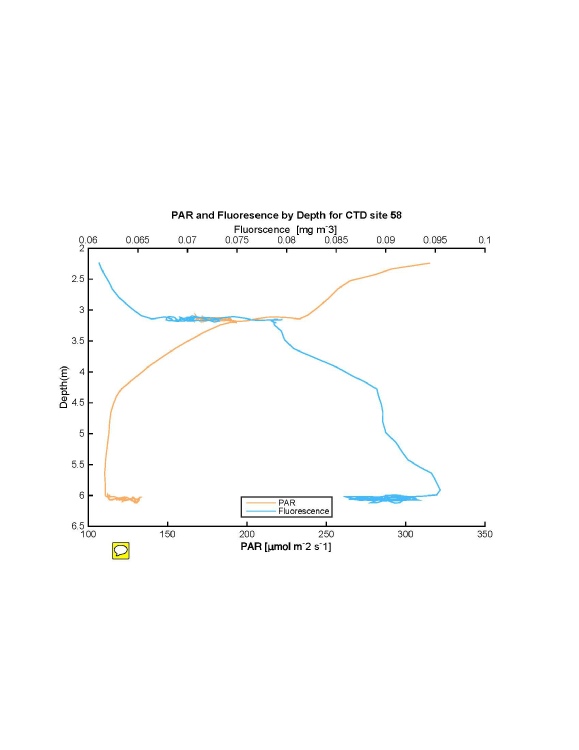
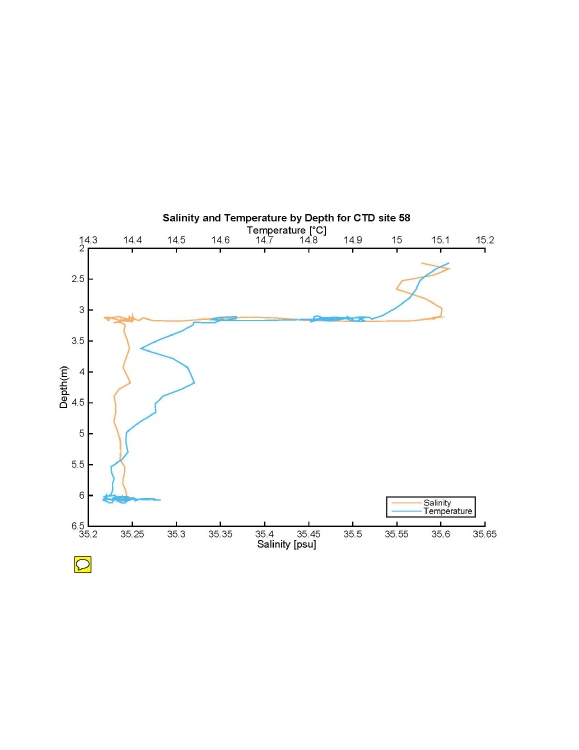
Figures 5 and 6: Graphs to show the relationship of PAR, fluorescence, salinity and temperature with depth at station 58 (St Mawes). Click to enlarge and read description.
Station 59
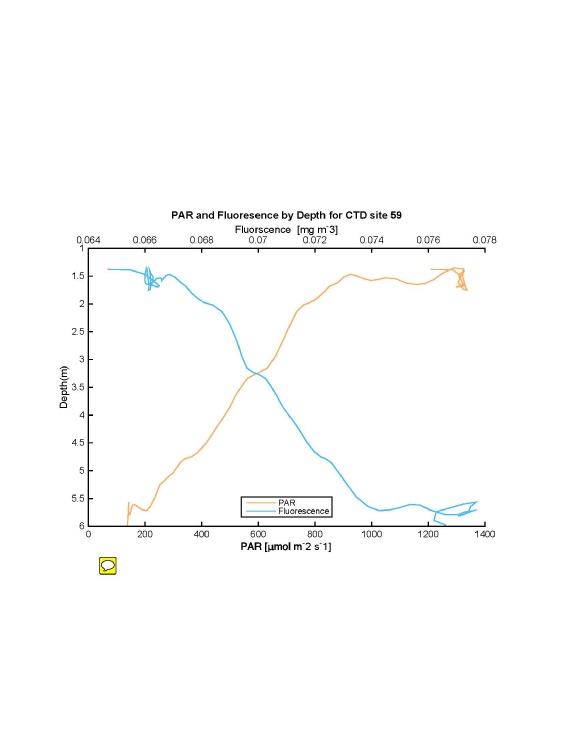
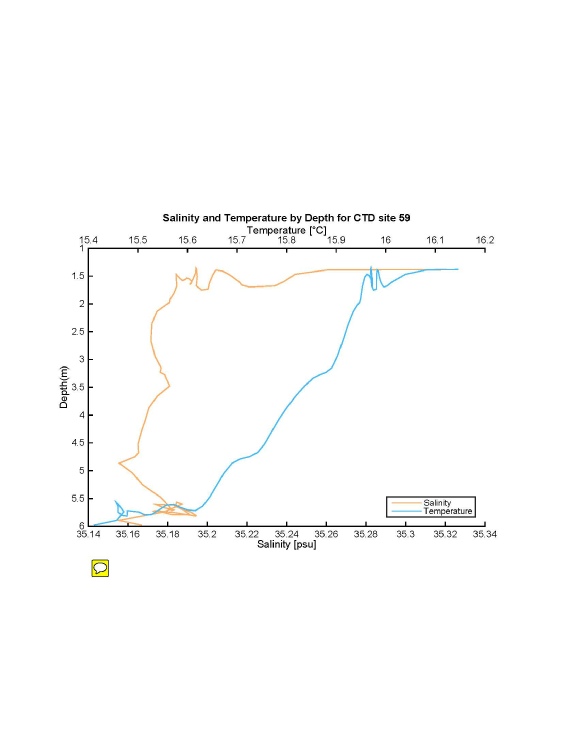
Figures 7 and 8: Graphs to show the relationship of PAR, fluorescence, salinity and temperature with depth at station 59 (Helford river estuary). Click to enlarge and read description.
Secchi Disk
The secchi disk was not deployed at the first station offshore, as the team member responsible was seasick. A strong south-easterly wind and associated large swells (sea state of 4) caused seasickness and the boat to head back towards shore. Station 57 had a lower light attenuation coefficient and deeper euphotic zone than the other stations, likely due to its position closer to the mouth of the Fal, whereas stations 58 and 59 were both within rivers, the Fal and the Helford respectively, and this is reflected by the higher levels of light attenuation and shallower euphotic zone recorded at those stations. Within the rivers there are higher nutrient concentrations and sediment inputs from land which would increase light attenuation in those areas. The table below contains the results obtained.
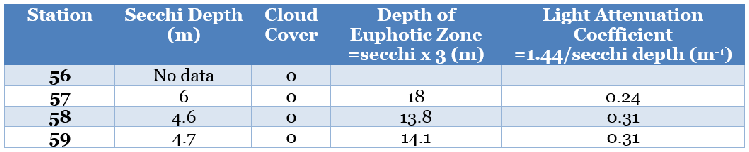
Table of secchi disk results and calculations. Note that calculations of the euphotic zone from secchi depths are less reliable than other methods due to the subjectiveness of this method.
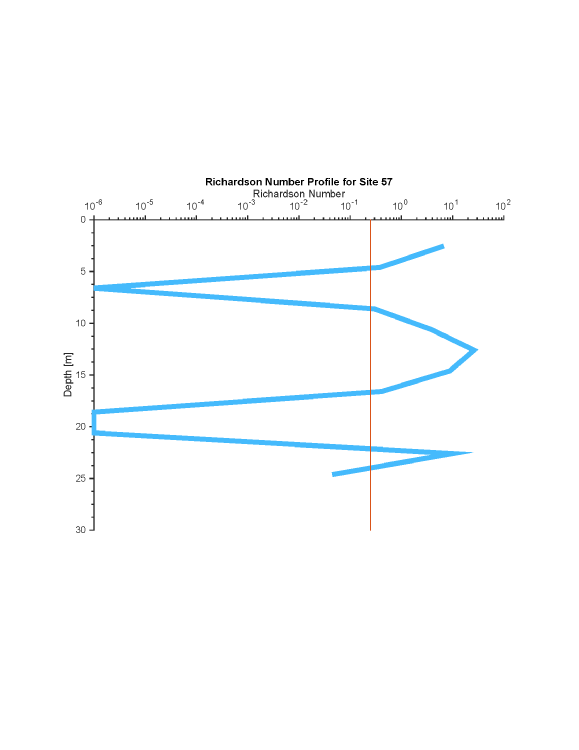
RICHARDSON NUMBERS
The Richardson number is a dimensionless number defined as the ratio between the density gradient and velocity shear. When Ri > 1, the flow can be considered stable and laminar. If Ri < 0.25 it is described as turbulent.
The following graphs show the relationship between Richardson’s numbers and depth at 2 of the stations. Click to enlarge.
Oxygen saturation and Chlorophyll a
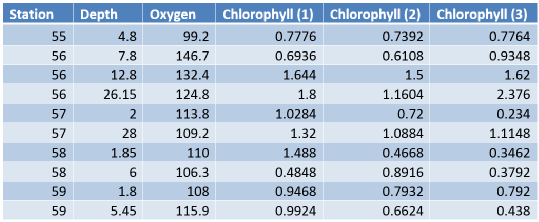
Oxygen (% saturation) Chlorophyll (mg/L) table against depths (m) for each CTD station.
. The opposite trend is apparent in the more estuarine stations, possibly due to surface replenishment of nutrients from rich riverine inputs. The general chlorophyll levels in the coastal and estuarine sites (58, 59 for example) are lower, which could be because estuarine waters are expected to be more turbid than the open ocean: reinforced by the Secchi depths being shallower at stations 58 and 59 (4.6 and 4.7m respectively) than at station 57 (6m).
Excluding station 59, oxygen mostly decreases with depth. This could be because of bacterial degradation of sinking organic matter, particularly because springtime (and therefore planktonic blooms) has just passed. Oxygen depletion could essentially here be considered as an indicator for heterotrophic activity.
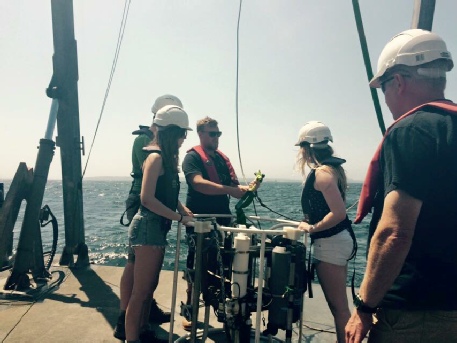
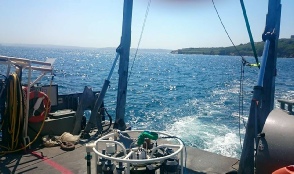
Preparation and deployment of the CTD rosette onboard the Callista.
This table shows the chlorophyll and oxygen concentrations calculated in the lab from niskin bottle collections. The samples were collected during a short voyage on board R.V Callista and represent a range of offshore as well as coastal/ estuarine sites. The offshore sites, such as 56 and 57, show an increase in chlorophyll concentration with depth. This could be a result of surface nutrient depletion and symptomatic of a phenomena known as a sub surface chlorophyll maxima.
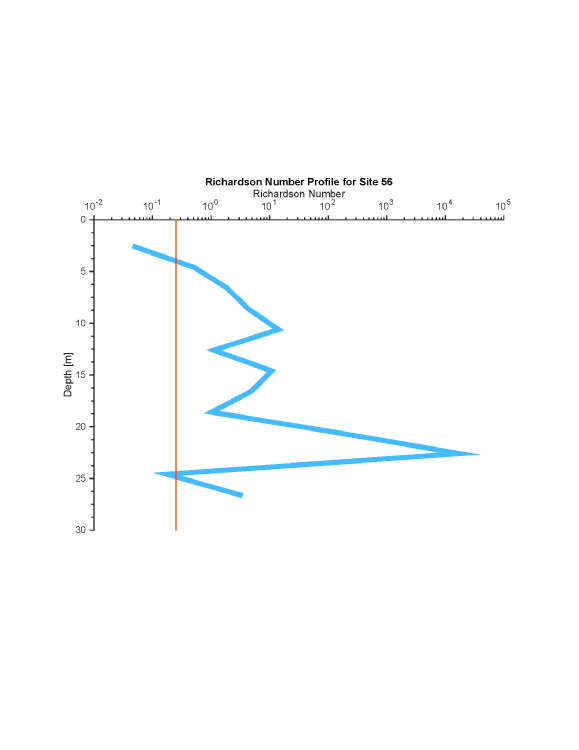
Station 56
Station 57
Station 56 - At both the top and bottom of the water column the water flow is largely turbulent. This is likely due to wind driven mixing at the surface disturbing the flow at the surface, as well as frictional forces coming into play close to the seabed. From 4m to 24m, the Richardson number fluctuates, however the flow remains laminar due to isolation from both the surface and seabed.
Station 57 - At this station, the Richardson number fluctuates considerably throughout the water column. The flow is laminar at the surface, possibly as a result of the reduced effect of wind driven mixing in the estuary. The fluctuations at all depths are likely due to the formation of multiple haloclines from the mixing of multiple inputs such as the Fal, St. Mawes River and the English Channel. As at Station 56, the flow becomes turbulent along the seabed, due to frictional forces.

The views on this website are solely those of Group 10, and are in no way affiliated with the views of University of Southampton or the National Oceanography Centre.

1. Powell, H. T., Holme, N. A., Knight, S. J. T. & Harvey, R. (1978). Survey of the littoral zone of Great Britain; Report on the shores of Devon and Cornwall. SMBA/MBA: Nature Conservancy Council
2. Miller, P. J. & El-Tawil, M. Y. (1974). A multidisciplinary approach to a new species of Gobius (Teleostei Gobiidea) from southern England. J.zool.Lond. 174, 539-574.
3. Brand, L. E. (1984). The salinity tolerance of forty-six marine phytoplankton isolates. Estuarine, Coastal and Shelf Science, 18(5), 543-556.
4. Sunda, W. G., & Huntsman, S. A. (1995). Iron uptake and growth limitation in oceanic and coastal phytoplankton. Marine Chemistry, 50(1), 189-206.
5. Petersen, J. E., Sanford, L. P., & Kemp, W. M. (1998). Coastal plankton responses to turbulent mixing in experimental ecosystems. Marine Ecology Progress Series, 171, 23-41.
6. Pedrotti, M. L., & Fenaux, L. (1992). Dispersal of echinoderm larvae in a geographical area marked by upwelling (Ligurian Sea, NW Mediterranean). Marine Ecology Progress Series, 86, 217-217.
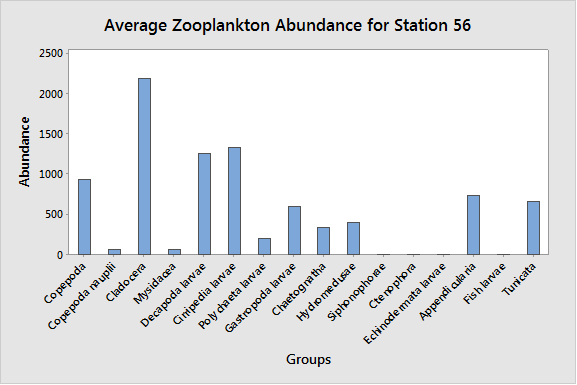
Station 56 was sampled at depth, between 15 and 10 metres below the surface. It is the most diversely populated station concerning zooplankton with 12 groups represented. It was also the most densely populated station surveyed during the offshore outing. The three main components of the zooplankton are Cladocerans (25% of the population), Cirriped larvae (15%) and decapod larvae (14%). Cladocerans seem to be an important species for all stations surveyed.
Station 58 was a shallower station; therefore the sampling depth was limited by the sea bed. Sampling was carried out between 4 metres and the surface. Copepods and Cladocerans stood out as the two main groups (38 and 32% respectively) while the other components of the zooplankton were found in similar numbers. Station 58 was shallow which indicates that most of the water column was sampled. Thus, the data is representative of the total zooplankton population for this particular station.
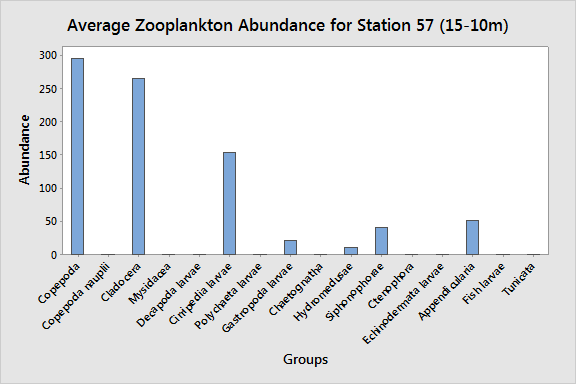
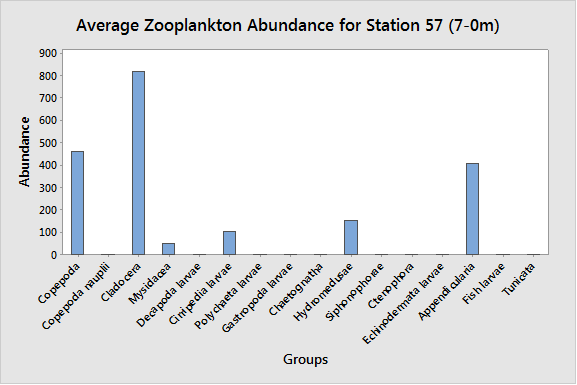
Station 57 logged the lowest zooplankton abundance of all stations surveyed offshore. As for station 56, the net was set for 15 to 10 metres depth. Copepods (35%) and Cladocerans (31%) dominated the zooplankton, with Cirriped larvae occupying a relatively important role as well (18%). Strangely, Stations 56 and 57 were sampled at the same depth but showed reasonably different zooplankton populations, both in abundance and diversity. This may be due to different mixing regimes, causing a patchy zooplankton distribution (5). Station 57 was also sampled between 7 metre depth and the surface. This second trawl was more than twice as dense, but was less divers than the deeper trawl (6 different groups as opposed to 7). Once again, Cladocerans dominated the zooplankton, occupying 41% of the population at the surface. Copepods (23%) and Appendicularia (20%) were also fairly important. The difference in population density and abundance between both depths could also be explained by mixing regimes or daily migration patterns.
| Introduction |
| Metadata |
| Biological |
| Chemical |
| Physical |
| References |
| Introduction |
| Metadata |
| Biological |
| Chemical |
| Physical |
| References |
| Introduction |
| Metadata |
| YSI |
| Flowmeter |
| Chlorophyll a |
| Irradiance |
| References |
| Introduction |
| Metadata |
| Methods |
| Sidescan |
| Video Ground-Truthing |
| Poster |
| References |