


Pontoon
On the morning of Monday 30th June 2014 we were collecting data at the Mylor pontoon
(King Harry ferry), 50°13.00N, 005°01.70. The aim of the day was to collect data
to form a time series of measurements taken at 30 minute intervals between 0830 and
1130 UTC-
The instrumentation included:
- YSI Probe
- Current Metre
- Chlorophyll Filtering

YSI Probe
The YSI Probe was deployed at the same point each 30 minute interval between 9.30am and 12.30pm from the pontoon and data was recorded at every metre (depth reached was water depth, and therefore tide dependent). From the probe we took values for: temperature, depth, salinity, pH, turbidity, chlorophyll, oxygen percentage saturation, oxygen mg/l and voltage. These data allowed the changes between the upper and lower water column to be measured.
Temperature
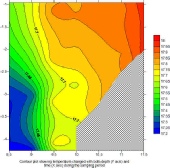
Our temperature data indicated that the temperature of the water column remained fairly constant during the time series as the temperature did not fluctuate by more than 1oC but there was a small change of 0.42oC in the upper water column and a 0.72oC increase in the lower water column. The temperature change is attributable to the effect of solar radiation during daylight hours. (Figure 1)
Salinity
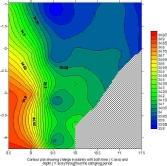
During the day our dataset showed that the salinity decreased throughout the water column. On the day of our measurements high tide was at 07.30 and low tide was at 13.55 which meant that the tide was falling during our study which may have affected the salinity of the water. The lower water column showed a larger and faster decrease changing from 39.4 at our first measurement to 33.8 at our last measurement. The upper water column however showed a drop from 34.4 to 38.8 during the same time. Our data indicates that earlier in the day there was a larger difference between the bottom and the surface than at our last measurement and shows that as time progresses the difference between the salinity of the surface and the bottom gradually decreases. (Figure 2)
Density
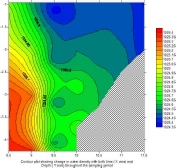
Throughout the time series the data also showed that the density of the water column
decreased. The upper water column showed a decrease of 0.51kgm-
Oxygen Percentage Saturation
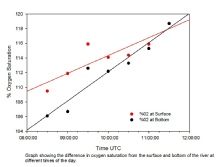
The percentage of oxygen saturation data indicated an increase with time within the water column which may reflect the activity of photosynthetic organisms during daylight hours. At our first measurement the percentage oxygen saturation was in the low 100s in the upper and lower water column showing values of 109% and 106% respectively. At our last measurement both also showed an increase reaching values of 115% and 118% respectively. There was a slight difference between the upper and lower water column which highlighted that the upper water column would always have a higher percentage oxygen saturation but the difference between the upper and lower water column is small. (Figure 4)

Chlorophyll
At each interval water samples were collected from the surface and filtered on site to be preserved in 6ml of acetone, and in a cold and dark environment. At each interval two samples were taken to provide replication.
The data collected from the YSI probe shows that the chlorophyll concentration in the water column was fairly constant during our time series. Our first two measurements showed only slight variations of 0.1 indicating a maximum in the middle of the water column. From 09.30am to 12.30pm the concentration of chlorophyll remained consistent at 1.7 at all depths. Our results for temperature and salinity suggest that the water column at the pontoon is well mixed implying that plankton are evenly distributed throughout the water column which would lead to a consistent chlorophyll concentration. The shallow depth of the river at the pontoon suggests that plankton would not be limited by light and therefore we would not expect to see any major changes in chlorophyll with depth.

Flow
The currents measured from the pontoon showed a peak in velocity (m/s) at depths
of 1-
There is an anomaly at 09.30 UTC, where the currents increased in velocity at 2.0m and 4.0m; this may be due to the residual wake of the passing vessels. Flow direction changed throughout the day due to the tidal cycle.
Contour Plot
Contour Plot
Contour Plot
Percentage Saturation between
Surface and Bottom
Discussion
We used the YSI probe to collect data about the physical and chemical characteristics of the river water column. We deployed the probe every ½ hour to create a time series of the salinity, oxygen concentration, temperature and density data to investigate the changes in the water column and how the changes vary between the upper and lower water column between 9.30am and 12.30pm.
During the day our dataset showed that the salinity decreased throughout the water column. On the day of our measurements high tide was at 07.30 and low tide was at 13.55 which meant that the tide was falling during our study which may have affected the salinity of the water. The lower water column showed a larger and faster decrease changing from 39.4 at our first measurement to 33.8 at our last measurement. The upper water column however showed a drop from 34.4 to 38.8 during the same time. Our data indicates that earlier in the day there was a larger difference between the bottom and the surface than at our last measurement and shows that as time progresses the difference between the salinity of the surface and the bottom gradually decreases.
The percentage of oxygen saturation data indicated an increase with time within the water column which may reflect the activity of photosynthetic organisms during daylight hours. At our first measurement the percentage oxygen saturation was in the low 100s in the upper and lower water column showing values of 109% and 106% respectively. At our last measurement both also showed an increase reaching values of 115% and 118% respectively. There was a slight difference between the upper and lower water column which highlighted that the upper water column would always have a higher percentage oxygen saturation but the difference between the upper and lower water column is small.
Our temperature data indicated that the temperature of the water column remained fairly constant during the time series as the temperature did not fluctuate by more than 1oC but there was a small change of 0.42oC in the upper water column and a 0.72oC increase in the lower water column. The temperature change is attributable to the effect of solar radiation during daylight hours.
Throughout the time series the data also showed that the density of the water column
decreased. The upper water column showed a decrease of 0.51kgm-