


Offshore
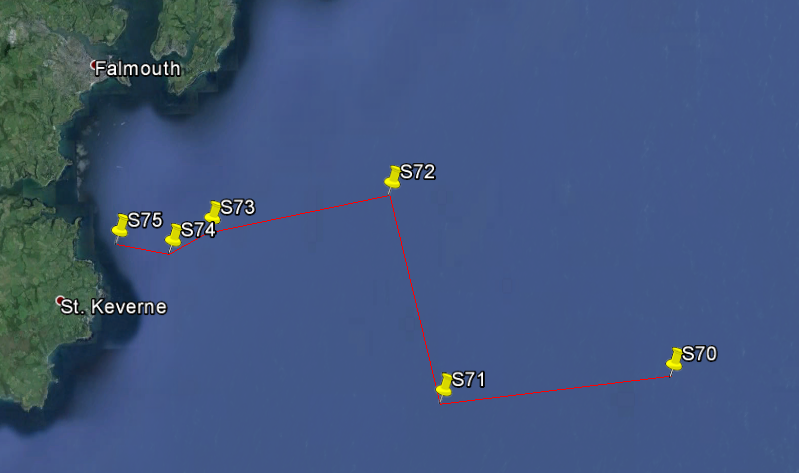
Offshore surveying was conducted on Thursday 3rd July 2014 between 8:00 and 17:00 at six stations working from the furthest offshore location inland back towards Falmouth Estuary. Similar to our estuary surveys, we were looking to sample water at various depths and distances [from land] to analyse chemical constituents, biological constituents and physical properties and respective depths and locations.
Throughout the day, the weather remained consistently clear and warm, with zero cloud coverage at most times with a maximum of one okta of cloud coverage. Wind was minimal and so the waters were calm with low swell.

Chemistry
At each off-
Silicon: At all stations where a silicon sample was recorded the results show a large
variability. Stations 71 and 75 show an increase in silicon concentration with depth
until they reach a peak, both approximately at 20 metres, the results then show that
beyond 20 metres silicon concentration starts to decrease with depth. Stations 70
and 73 both decrease in silicon concentration. Station 70 has a linear decrease in
silicon concentration up to a depth of 20 metres, station 73 reaches a silicon minimum
at approximately 25 metres, silicon then increases in concentration sharply from
approximately 2.4 µmolL-
Nitrate: The concentration of nitrate in the water column at our offshore sites was
highly variable. The plot of every water sample we took indicates no obvious pattern
of nitrate concentration in relation to depth. When looking at the nitrate data at
each station we noticed that each station showed a different pattern of nitrate concentration.
Two water samples were taken at station 70 and the nitrate values indicate a decreasing
concentration with depth. Three water samples were collected at station 71 at 7.4m,
23.7m and 50.1m respectively which show that there was a nitrate maximum at mid-
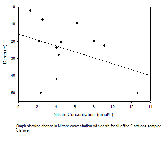
Phosphate: Phosphate levels showed a great deal of variability with depth at the four sampling stations. Levels increased with depth at stations 71 and 72, and decreased with depth at stations 70 and 74. Few samples were taken at each station due to limits on both time and bottles, and so it is difficult to infer any useful information about the distribution of phosphate in the water column at this resolution. However, when comparing this graph to that of chlorophyll concentration, the graph with the greatest change in phosphate concentration, station 70, also had the greatest peak in chlorophyll, showing how this macronutrient may be being affected by phytoplankton growth. (Figure 3)
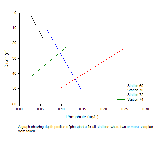
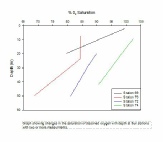
Dissolved Oxygen: The change in the saturation of oxygen with depth shows a definite trend, moving deeper in the water column we see a decrease in the percentage of dissolved oxygen. Station 70 shows a saturation of around 85% in surface water and a saturation of below 70% at 50m.
Oxygen saturation also seems to increase as the water shallows, with the maximum saturation at station 70 as 85% and the maximum closer inshore at station 74 being above 100%. (Figure 4)

Biology
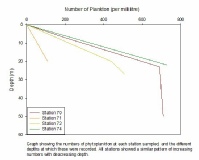
Phytoplankton: The highest number of phytoplankton and the fastest rate of increase were recorded at Station 74, with 730 per millilitre. The lowest number of phytoplankton and slowest rate of increase was at Station 71, with 110 per millilitre. All the sites showed a generally similar pattern of increasing numbers with increasing depth. An unusual pattern was displayed at Station 70, with a near plateau effect on numbers after 23m. This could be explained by a limiting factor, possibly a desirable nutrient deficiency such as iron or zinc. (Figure 1)
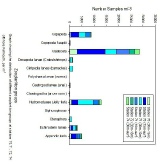
Zooplankton: The main zooplankton species found throughout all stations was the Cladocera,
this was mainly found at the surface to 15m depths at station 70. The majority of
all the zooplankton found were sampled from the surface to 15m. Very few zooplankton
were found past the 15m depth up to 32m. Only the Cladocera was found from 18m to
32m at station 72. Hydromedusae (jellyfish) was present in abundance between 10-
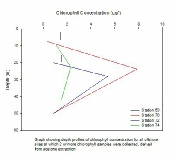
Chlorophyll: In general the chlorophyll samples show the presence of a deep chlorophyll maximum at around 20 to 30m, with concentrations much lower towards the surface and the seabed. Station 7 showed the greatest concentrations, with a peak at 24m of 7.8µg/l. Station 72 showed a very similar pattern, although the maximum concentrations observed at this site were not as great as that of station 70.
The chlorophyll samples were taken using niskin bottles attached to a rosette on a CTD. As such, the samples with high chlorophyll concentration could be taken within the deep chlorophyll maximum showed by the flourometer on the CTD. More detail on the dispersion of chlorophyll within the water column can be seen by comparison with the data collected by this instrument. (Figure 3)

Physics
CTD:
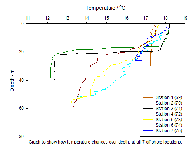
The temperature vs depth graph (Figure 1) shows that at all stations temperature decreased with depth. Stations 71 and 72 had the greatest depths, this may represent why there is a very dominant thermocline. At 20 metres the temperature decreases by 6oC from 18oC to 12oC. From 20 metres to approximately 70 metres, the temperature stays constant at 12oC at stations 71 and 72. All other stations decrease in temperature more gradually. The stations with the lowest water depth, stations 70 and 76, change in temperature by 0.5oC and 1.5 oC respectively.
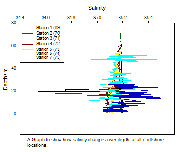
At all stations the salinity vs depth graph (Figure 2) shows a great variability in salinity throughout the depth. Station 72 shows a high variability in salinity with depth across salinities 34.6 to 35. Whereas, stations 75 and 76 have a variability in salinity with depth across salinities 35.0 to 35.4. The majority of the variability occurs at 20 metres, this corresponds to where the thermocline occurred (shown from the Temperature vs Depth figure) which may indicate that a halocline is trying to form.
Data had to be removed from the Fluorescence vs Depth graph at Station 72, where the fluorescence maximum was 4.84 v between 0.89m and 1.15 m. This enabled us to view the fluorescence between 0.00v and 0.30v at greater detail. At stations 71 and 4 there is only one maximum peak whereas at all other stations there are two. Station 74 has the lowest fluorescence value at 0.15v at a depth of 43.3m. The shallowest peak in chlorophyll maximum occurred at station 72, noted above.
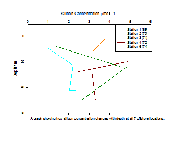
ADCP: The offshore ADCP transect (Figure 3) shows the level of backscatter produced
by particulate matter. High backscatter in the surface 5m of the water column is
produced by the wake of the boat. Backscatter in the top 30m may be caused by phytoplankton
masses-
Depth Profile
Depth Profile
Depth Profile
Depth Profile
Oxygen Depth Profile
Depth Profile
Concentration.
Abundance
Depth Profile
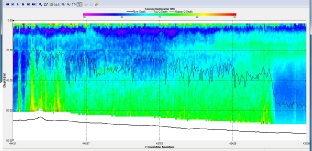
Backscatter for station 71 to 72

Discussion
Surveying the selected offshore locations provided data to give insight into the stratification of the waters off the south coast of Cornwall leading into the Falmouth Estuary. The data was made more interesting by the fact that although the weather on the day of the survey was clear, the weather on the days previous had not been as fair, with wind gusts and rain creating choppy conditions and therefore a breakdown of both the temperature and nutrient stratification boundaries.
A silicon boundary layer was observed at all stations ~20 metres depth; according to CTD data an observed thermocline and halocline occurred at similar respective depths, which corresponds to previous data [1]. Similarly, the silicon maximum occurred at most stations at around the similar depth, indicating high chlorophyll levels and primary production in this region [2].
Nitrate and phosphate levels were equally varied throughout the stations. Nutrients in these areas seem to be interdependent on anthropogenic constituents and localised limiting factors [3].
Nutrient levels were observed to be collaborated with primary production growth and chlorophyll levels. Where macronutirent levels were highest, phytoplankton growth and chlorophyll levels showed equal increases having recently gone through late spring blooms [4].
[1] Pingree, R. (1975). The advance and retreat of the thermocline on the continental
shelf. Journal of the Marine Biological Association of the United Kingdom, 55(04),
pp.965-
[2] Neal, C., Neal, M., Reynolds, B., Maberly, S., May, L., Ferrier, R., Smith, J.
and Parker, J. (2005). Silicon concentrations in UK surface waters. Journal of hydrology,
304(1), pp.75-
[3] Lee, J., McFiggans, G., Allan, J., Baker, A., Ball, S., Benton, A., Carpenter,
L., Commane, R., Finley, B., Evans, M. and others, (2010). Reactive halogens in the
marine boundary layer (RHaMBLe): the tropical North Atlantic experiments. Atmospheric
Chemistry and Physics, 10(3), pp.1031-
[4] Smyth, T., Fishwick, J., Lisa, A., Cummings, D., Harris, C., Kitidis, V., Rees,
A., Martinez-