Disclaimer: The views expressed within this website do not represent the views of the National Oceanographic Centre of Southampton; University of Southampton; or Falmouth Marine School. We would like to thank Falmouth Marine School for the collaborative efforts involved.
Overview
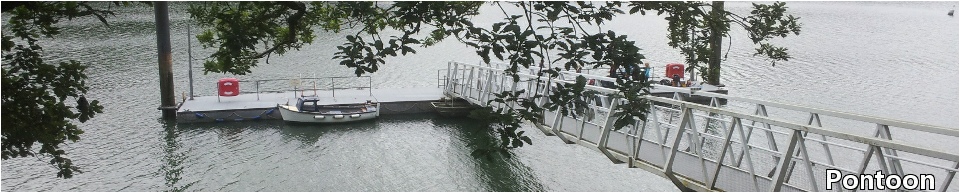
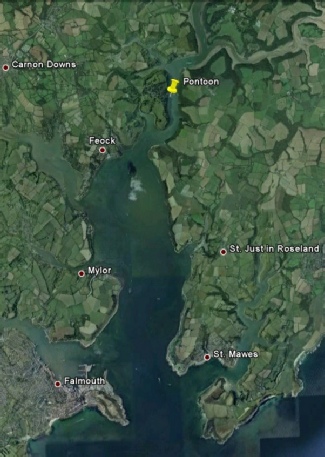
With the use of the King Harry Pontoon halfway down the Fal River, group 5 carried out sampling of the surrounding water. A Secchi disc, current meter, light meter and YSI probe were used to measure the following parameters: temperature, salinity, depth, dissolved oxygen, pH, current speed and direction and light. Measurements were taken every 30 minutes starting at 0845UTC and finishing at 1215UTC. The results from all groups were collated in order to obtain a time series. The pontoon can be found at the points 50° 12.57’ N 005° 01.37’ W.
Temperature
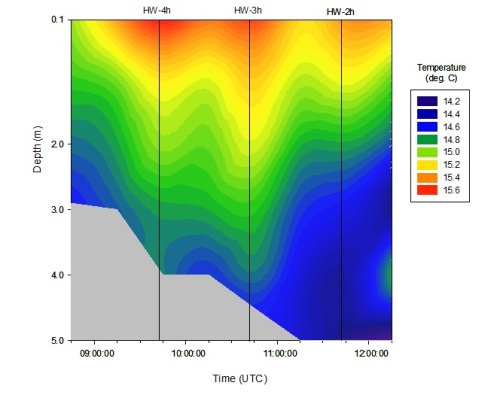
The temperature of the water column is higher at the surface and decreases with depth as shown by (figure). The increased temperature at the surface is due to solar radiation heating the top layer of the water column. A change of around 1°C is indicated between the surface and the depth. Around 1000UTC the water column is, on a whole, warmer than at 1130UTC, due to warmer water penetrating further down the water column. As the tidal height increased, increasing the sample depth, the temperature of the lower water column decreases.
Salinity
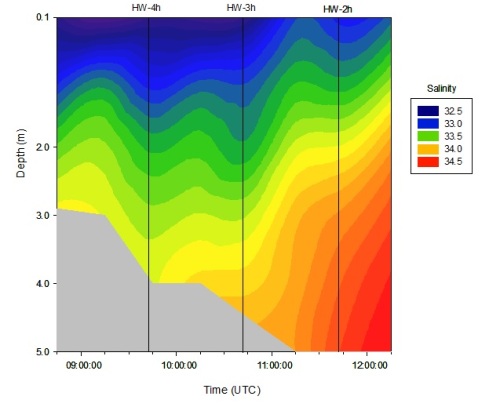
Salinity increases with depth as indicated in (figure). The salinity is lowest at the surface due to the freshwater riverine input, and also high rainfall from the previous day. The freshwater is less dense and therefore sits on top of the more dense salty water. The salinity increases at depth due the intrusion of sea water from the flowing tide.
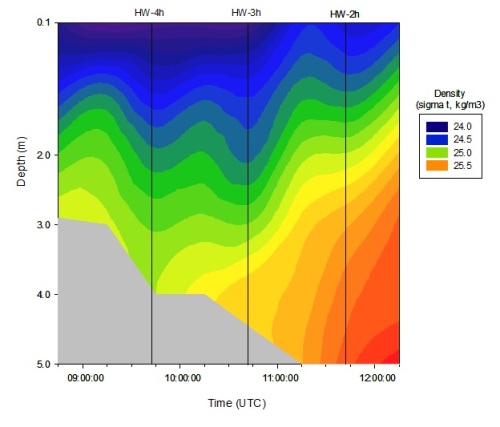
Density
Density is directly influenced by temperature and salinity. The density profile of the water column (figure) generally increases over the duration of the time series. This is a direct result of the general decrease in temperature and increase in salinity observed. Both of these property changes are due to the influence of colder, more saline water from the flowing tide.
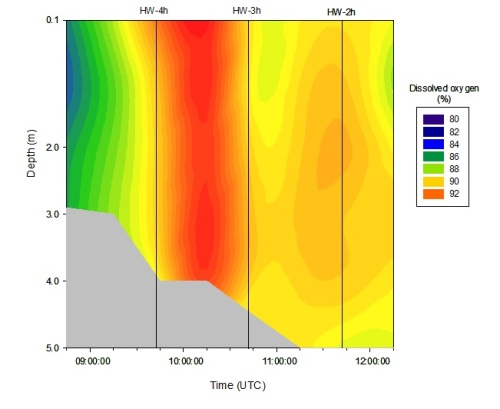
Dissolved Oxygen
Dissolved oxygen saw a sharp increase from 82% to 92%, peaking at 1015UTC, see (figure). This gradient of increase then flattened out and dissolved oxygen throughout the water column became far more uniform over the 2 hour time period. Dissolved oxygen is affected by the temperature of the water, with the capacity for dissolved oxygen increasing with decreasing temperature; a trend that was present during the observation. Dissolved oxygen is also influenced by levels of primary production in the area, however without any recorded data regarding this parameter, any reference to it would be speculative.
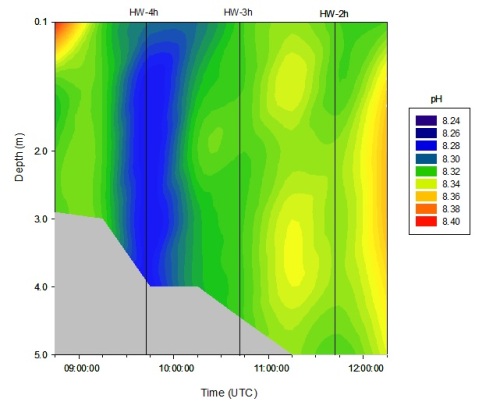
pH
Despite the increase of dissolved oxygen in the water column, which generally results in a more basic pH value, the pH profile of the water column decreases at roughly 0945UTC, see (figure). This decrease in pH is very small at 0.4, but due to the scale of the graph it appears to be more dramatic. This pH change is not very significant and could be due to systematic or human error.
Estep, L. 1992, ‘Profile models of the diffuse attenuation coefficient’, Environmental
Software, 7, 2, 95-
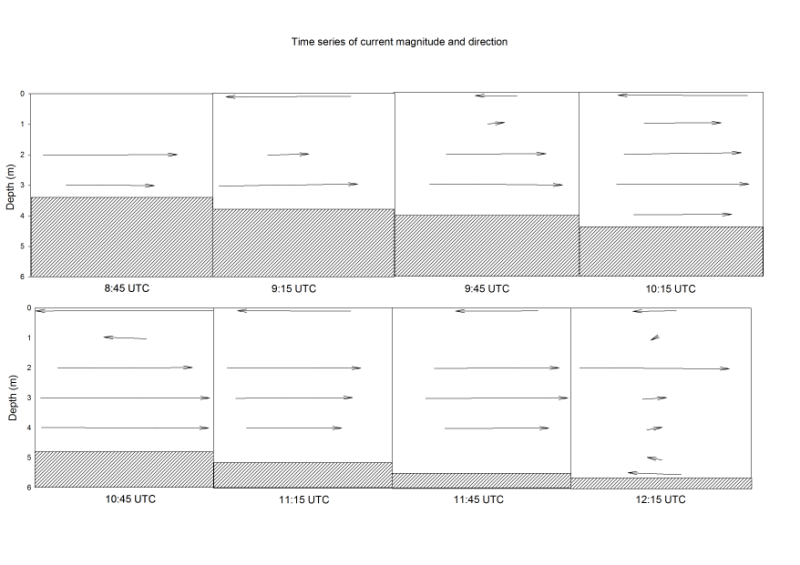
Current magnitude and direction
The current magnitude and direction are represented by a series of vector plots over
the duration of the study (from after low tide to just before high tide). (Figure)
shows the tidal current increasing in intensity (up to 0.13 m.s-
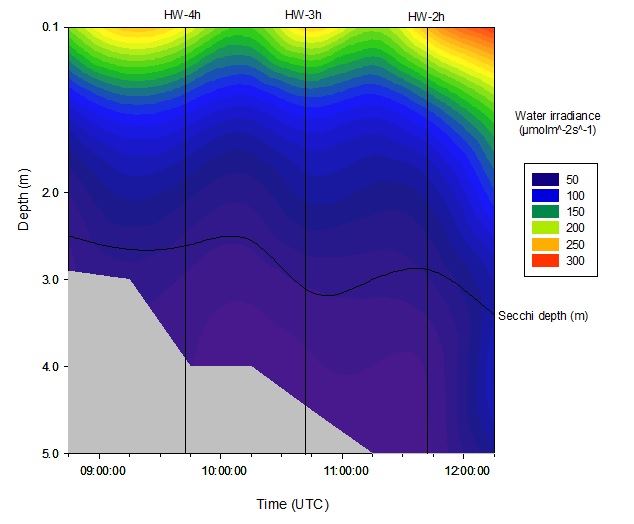
Irradiance
From the (figure), it is clear that the strongest irradiance is at the surface. For
the majority of the time series, there was 8/8 oktas cloud cover, meaning that the
overall irradiance would be relatively low (i.e below 200 µmol.m-
Attenuation coefficient
During the sampling of the shallow waters, at the pontoon on the River Fal, the 1% light depth, as estimated by both the Secchi disk and the light probe and PAR meter, was not reached. This is because the water column was too shallow. Light attenuation coefficients, k values, vary significantly in depths shallower than the 1% light depth and therefore they have not been calculated at the pontoon (Estep, 1992).

Time Series
Temperature
Salinity
Density
Dissolved Oxygen
pH
Current
Irradiance
| Activites |
| About Us |
| References |
| Physical |
| Chemical |
| Biological |
| References |
| Physical |
| Chemical |
| Biological |
| References |
| Poster |
| References |
| YSI Probe |
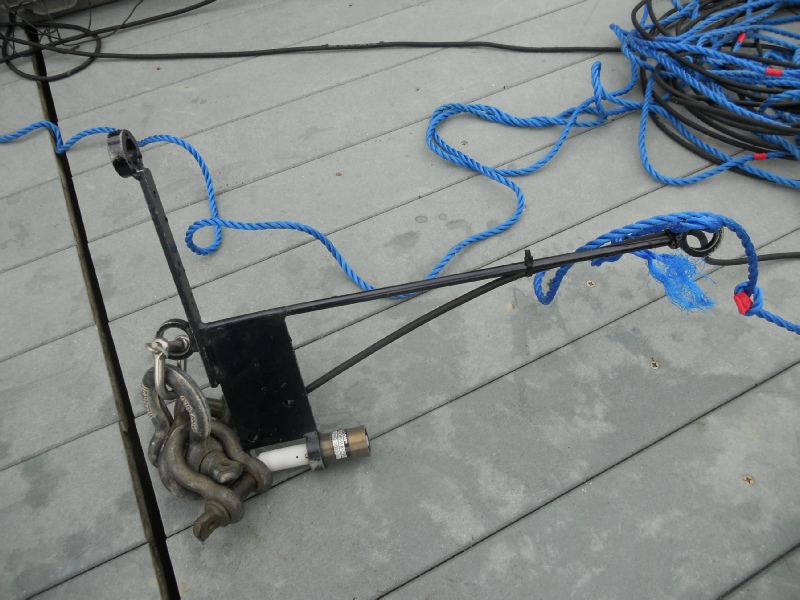
| Current Meter |
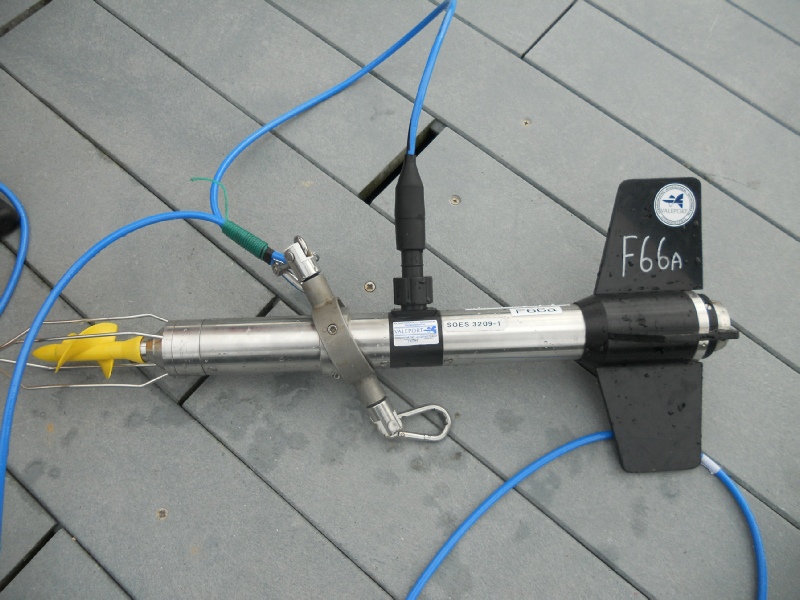
| Light Meter |
| References |