Disclaimer: The views expressed within this website do not represent the views of the National Oceanographic Centre of Southampton; University of Southampton; or Falmouth Marine School. We would like to thank Falmouth Marine School for the collaborative efforts involved.
Welcome
Falmouth has the third deepest natural harbour in the world and consists of a diverse and unique ecosystem of national importance (falmouthport), (falmouth). We are a group of students attending the University of Southampton, studying physical, chemical and biological attributes associated with the Fal River. Research has been carried out in the estuary and offshore in the western English Channel off Falmouth.
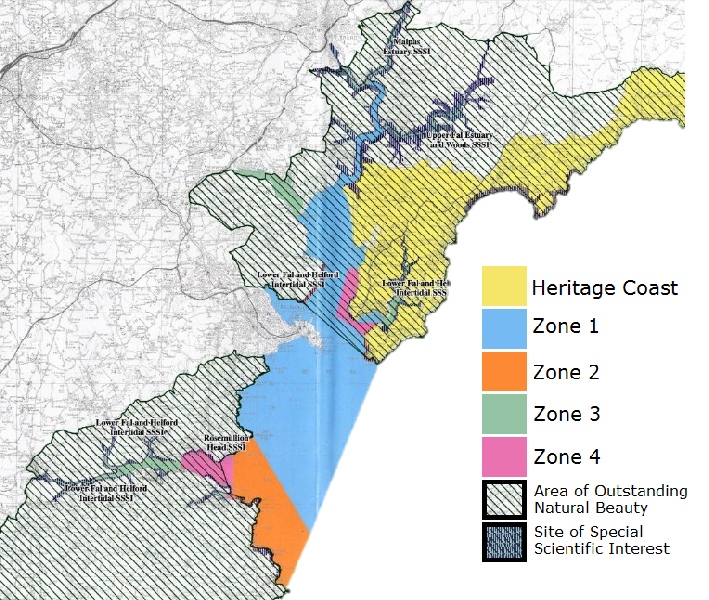
A variety of unique biotopes, located in the bays, the estuary and the offshore regions of Falmouth, have been selected as Special Areas of Conservation (SAC). These consist of rare habitats and species produced by the unusual features including saltmarshes, intertidal mudflats, subtidal sandbanks, large shallow inlets, bays, the Fal Estuary itself and reefs (see map below). Rare maerl beds in the Fal Estuary provide shelter and favourable habitats for a range of plant and animal species.
The objectives of these SACs are in place to protect the features of interest, and allow efficient management of operations and human activities at the site to prevent impacts such as smothering of the seabed or tidal regime change. The objectives state; maintenance of large shallow inlets, subtidal sandbanks, estuaries, intertidal sand and mudflats and the saltmarsh in favourable condition. Details of this legislation can be viewed in the Fal & Helford Special Area of Conservation Management Scheme at Natural England, 2000.
Falmouth bid, no date, Key Stats & Facts, [Online]. Available: http://www.falmouth.co.uk/falmouth-
Natural England, 2000, Fal and Helford Management Scheme [Online]. http://publications.naturalengland.org.uk/publication/3048654?category=3212324 (Accessed: 2013 June 29th)
Pond, L. 2007, A brief History of Falmouth, [Online]. Available: http://www.falmouthport.co.uk/commercial/html/history.php (Accessed, 2013 June 29th)
We are a group of students studying at the University of Southampton. Students in this group include:
Francesca Eyre – Msci Marine Biology
Sam Forbes -
Anda Vladoiu -
Jenny Jardine -
Luke Morris -
Richard Adams -
Jade Chenery -
Stephanie Wells -
Liz Talbot -
Sarah Harding -
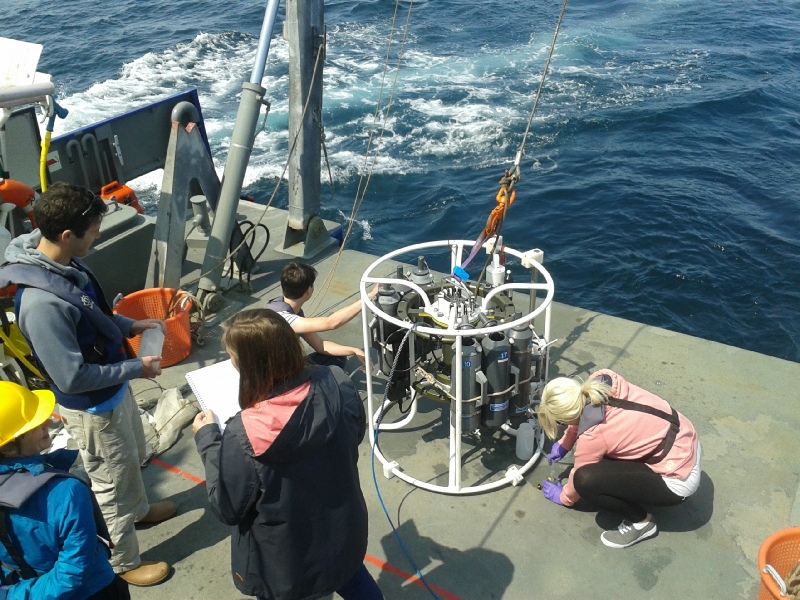
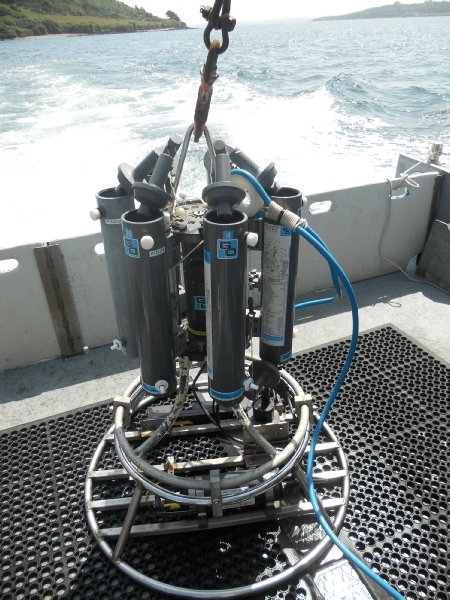
Samples were collected at 5 stations offshore of Falmouth in order to locate the presence of a front. Investigations included: biological analysis to identify the species of phytoplankton and zooplankton; chemical analysis to determine the composition of the waters at each station by studying the dissolved oxygen and nutrient content of nitrate and phosphate and chlorophyll; and physical analysis of the thermocline and mixing that occurs within the water column.
During the survey on the 28th of June, 2013, side scan sonar was used to map the seabed substrate, supported by a live video feed of the habitat. We were unable to groundtruth using the preferred mechanism, a grab, as the areas involved are all parts of a special area of conservation.
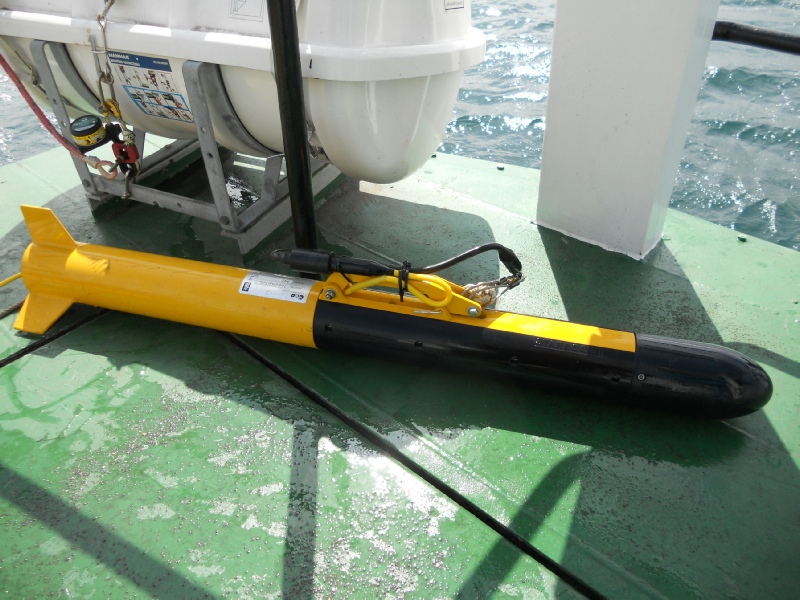
On the 1st of July, 2013, we aimed to analyse the changes in the biological, chemical and physical characteristics over the vertical water column and length of the Fal estuary. Samples were collected by Groups 5 & 3 of SOES3018 at 8 stations in the estuary. Zooplankton and phytoplankton species, taken from net trawls and water samples respectively, have been used to look at the changes in composition from the upper estuary to Black Rock. Dissolved oxygen concentrations along with nitrate, phosphate and dissolved silicon concentrations have also been used to analyse chemical and nutrient changes, both with depth and position up the estuary. ADCP data has been used to look at the changes in flow across entire horizontal tracks at each station.
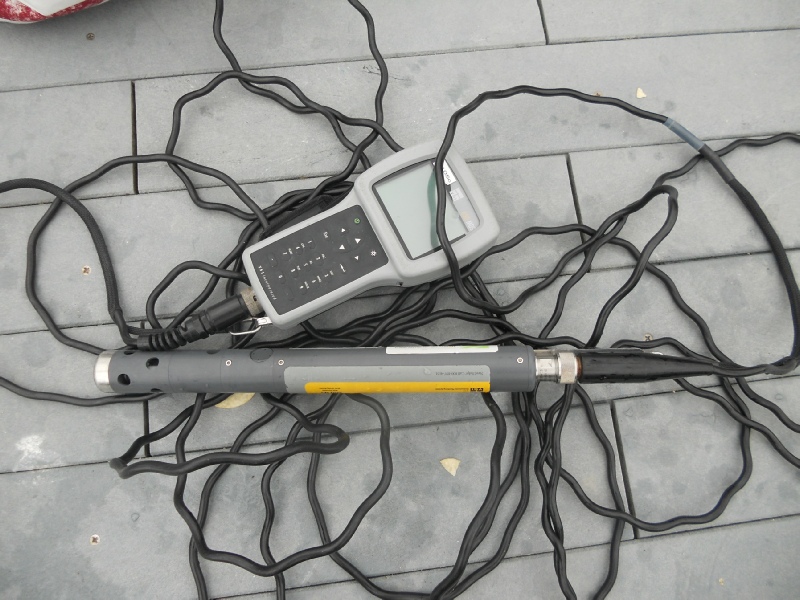
Every 30 minutes, measurements of current speed and direction, irradiance, temperature, salinity, pH, density and dissolved oxygen were taken at King Harry’s Ferry pontoon over a period of three and half hours. These were recorded at depth intervals with the use of a current meter, YSI probe and light probe in order to build up a time series over depth of the change of these parameters.
| Activites |
| About Us |
| References |
| Physical |
| Chemical |
| Biological |
| References |
| Physical |
| Chemical |
| Biological |
| References |
| Poster |
| References |
| YSI Probe |
| Current Meter |
| Light Meter |
| References |