Disclaimer: The views expressed within this website do not represent the views of the National Oceanographic Centre of Southampton; University of Southampton; or Falmouth Marine School. We would like to thank Falmouth Marine School for the collaborative efforts involved.
Overview
Sampling
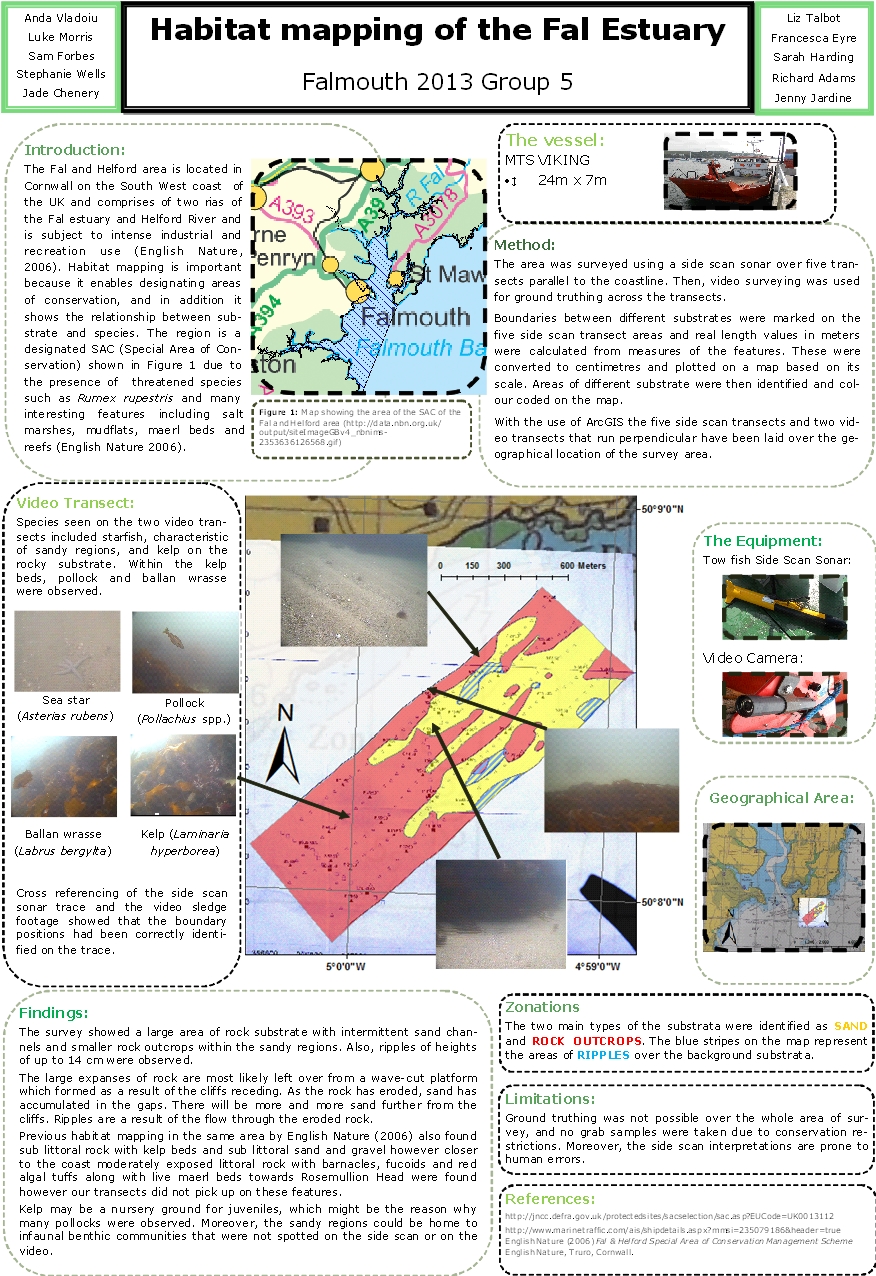
Using side scan sonar and video surveying, it was seen that there is a large area of rock substrate with intermittent sand channels and smaller rock outcrops between. Areas of ripples up to 14cm in height were also seen scattered about the area. From the video, kelp beds were found on the rock substrate, providing a habitat and nursing ground for fish such as pollock and ballan wrasse. Multiple sea stars were observed in the sand channels, which became more and more dominant further away from the cliffs parallel to the transects. There are known maerl beds in the area of the Fal Estuary, however these were not found in the area surveyed.
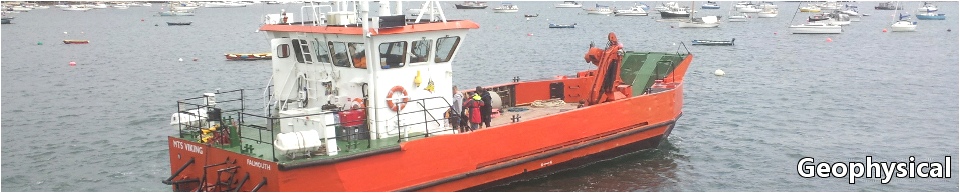
On the 28th of June, Group 5 undertook a survey of an area outside the mouth of the Fal Estuary, just to the east, on board the hired vessel, Viking. The survey was carried out through the use of side scan sonar mounted on a tow fish, in conjunction with a video camera mounted on a sledge. The side scan sonar provided topographical and textural data relating to the area whilst the video sledge provided data regarding the species present in the area as well as “ground truthing” the side scan data.
On the 29th of June 2013, group 5 analysed the raw side scan trace. Using the timestamps on the trace in conjunction with the start and end times recorded in the log book, each transect was separated and reconstructed accordingly. Identifying and marking the major rock outcrops, boundary lines were constructed and numbered points were added sporadically along the lines. The true scale of the features were calculated from a series of measurements on an excel spreadsheet and were redrawn on an A2 plot of the survey and video transects, produced from data in Surfer.
Using the navigation data from the boat, and the start and finish times recorded in the logbook for the transects, the 5 transects were plotted on a track using Surfer. The frequency of the intervals was set to 2 so that each time stamp is 20 seconds apart. Another plot was then layered on top of the time stamps every 12th data point to show a time stamp every 2 minutes. The video transects were then overlaid on top of the side scan transects, applying the same technique as above, using navigation data and log book records with data points for every minute. The time stamps were then replaced with symbols every 5 minutes. The scale of the plot was then set to 1cm=100m. The axis limits were changed in order to ensure there was 100m left blank around the end data points to account for the 75m range of the side scanner. This was then printed off at 400% scale and tiled onto A4 pages; then aligned in order to create an A2 size plot.
The video transects were next used to ground truth the side scan data and boundary findings. Screen shots have been taken at points of interest and were added to poster in relation to their location; using the times recorded in the log book to locate them on to the printed plot and on the side scan. Species seen on the video were also noted.
| Activites |
| About Us |
| References |
| Physical |
| Chemical |
| Biological |
| References |
| Physical |
| Chemical |
| Biological |
| References |
| Poster |
| References |
| YSI Probe |
| Current Meter |
| Light Meter |
| References |