
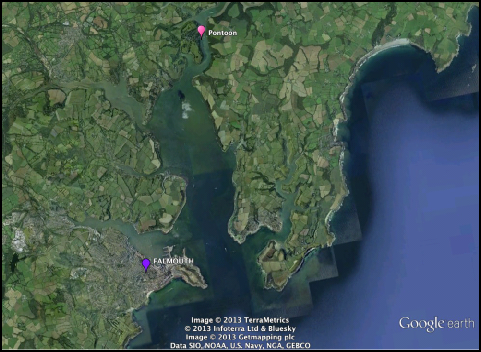
The Fal estuary is a Ria type estuary; the salinity gradient observed within the estuary is very gradual. The pontoon is located at 50o 12.57N, 0050 01.39W (fig. 1) and here the observed salinities are still expected to be relatively high. The tidal range at the position of the pontoon is 5.3m, meaning significant changes can be observed within the tidal cycle. As the tide turns, changes in the flow rate and salinity profile can be observed.
Through collecting data via this shore station an understanding of the properties of the Fal estuary, with respects to the freshwater input end, can be compiled. The conclusions from Pontoon data analysis combined with the data collected from other sites throughout the estuary, via RV Bill Conway, will allow us to understand the change in characteristics within the water column over the tidal cycle. Data collected from the estuary and offshore sites can be combined with this data to allow us to draw conclusions about how the Fal estuary acts as a transition zone between the freshwater input and the coastal environment.
A YSI probe, Secchi disk, light meter and current meter were used at half hour intervals to give an accurate time series over the 150 minute period we were stationed on the pontoon. The time series also gave an insight into how the various parameters changed over the course of the tidal cycle, since the first sample was taken at 1300 UTC, and low tide was at 1434 UTC, meaning data was collected either side of low tide. Current readings were taken at the surface and at 1m depth, light and YSI readings were taken at 3 depths, typically at the surface, 1m, and a third depth, which varied depending on the overall water depth, typically 1.5 – 1.8m.
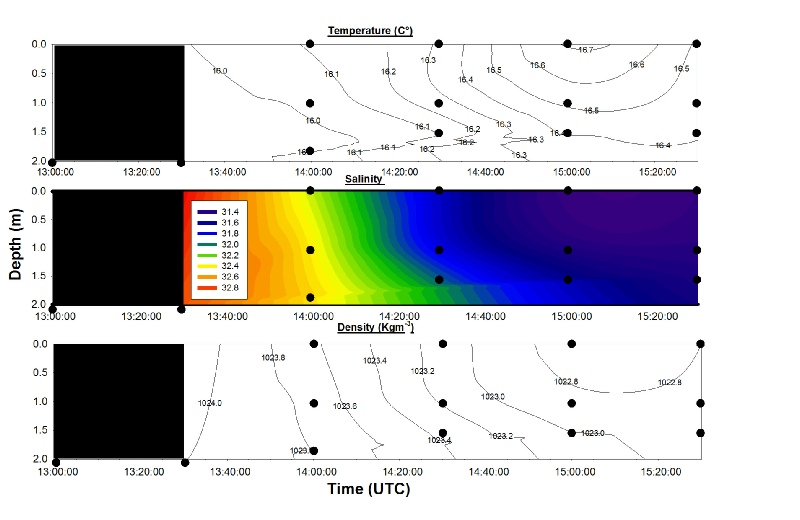
Figure 2 shows a high salinity at 13:40. High water was recorded at 8:01 UTC, as the tide ebbs, and low tide is approached, there is a marked decrease in salinity. The saline intrusion retreats down the river valley meaning river water makes up a larger proportion of the water. This is especially notable in the surface layer due to the formation of a pycnocline. Warmer, less saline water is buoyant, so preferentially stays in the upper layer. This stratification is marginally broken down due to shear instabilities allowing exchange across the density interface. During slack water, where shear is less, we see stronger stratification.
Extreme weather conditions did not affect data collection, as there was extreme rainfall or evaporation. Hence, the profiles seen are a direct result of tidal influence. The warmer surface layer could be a result of direct heating of the water in the estuary, or could be due to the addition of warmer river water being added to the surface layer.
The water at 15:00 UTC is not as dense as the water seen earlier in the day, due to the fact that water is fresher and warmer.
The Tide times observed were high tides at 08:01 and 20:17 with low tides at 02:16
and 14:34. These values are for the sea at Falmouth, with a slight delay in reaching
the point of the pontoon. Winds were light, and unlikely to have had a significant
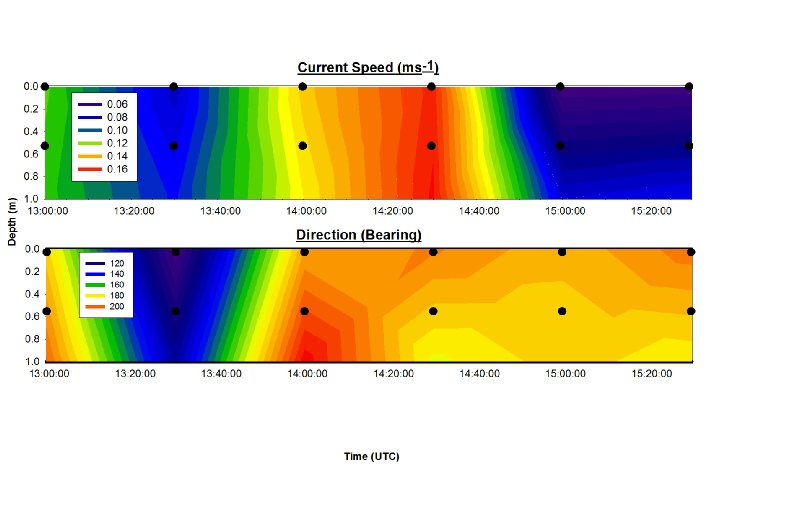
effect on the current. Bearing of the current (fig. 3) weakens either side of the
low tide, but the expectation of this should be that it shifts direction by 180°
when the tide turns, with the predominant flow starting to come from the sea after
the low tide. Although current speed appears to increase around the low tide, this
could be due to a slight increase in wind, or other conditions, at this time as the
shift is very slight, (0.1ms-
There are several limitations associated with the Pontoon exercise, the major issue
being the time scale there is to make the appropriate measurements. The data was
recorded from 13:00-
Light meter readings were particularly inaccurate, since the equipment was reading a clearly inaccurate reading throughout the day. For the first 2 samples taken at 1300 and 1330, YSI data was not profiled, and was instead just taken at 2m depth. This made it difficult to determine whether the data collected was accurate.
The water depth has an effect on all the instruments, and with the deepest point being 2m it made it difficult to determine how the data changes with depth.
The position of the sampling with respect to the pontoon had a major effect on the current changes that were being recorded. The first current meter reading was taken at the front of the pontoon, which retarded the flow giving questionable results. Subsequent readings were taken from the side of the pontoon, where the flow appeared to be unaffected by the presence of the pontoon.
Wind speed and direction are parameters that we were not able to record; these restrictions prevent quantification of the effect of wind on current velocity in order to isolate tidal effects.
Weather conditions
Overcast, with 8/8 cloud cover, and a light wind was present
Tide conditions:
High Water: 08:01, 20:17
Low Water: 02:16, 14:34
Fig. 1 map showing location of King Harry pontoon
Fig. 2 contour plot showing temperature, salinity and density at the pontoon.
Fig. 3 contour plot showing current speed and direction at the pontoon.
Disclaimer: The opinions and conclusions expressed in this website are not affiliated with those of the National Oceanography Centre or the University of Southampton.
| Introduction |
| Methodology |
| Physical analysis |
| Chemical and phytoplankton |
| Zooplankton |
| Introduction |
| Methodology |
| Side-scan |
| video transect |
| Limitations |
| Poster |
| Introduction |
| Methodology |
| Results |
| Limitations |
| Introduction |
| Methodology |
| Physical analysis |
| Chemical analysis |
| Biological analysis |
| Limitations |