Click on image to enlarge
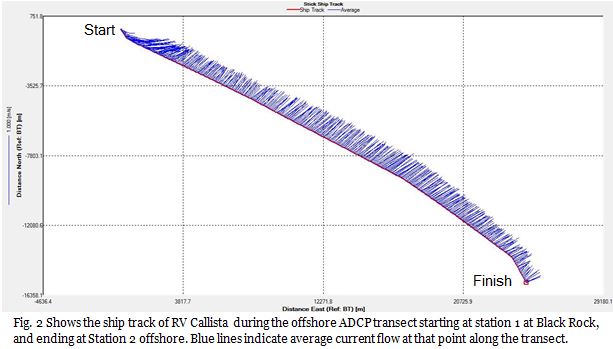
Fig.2
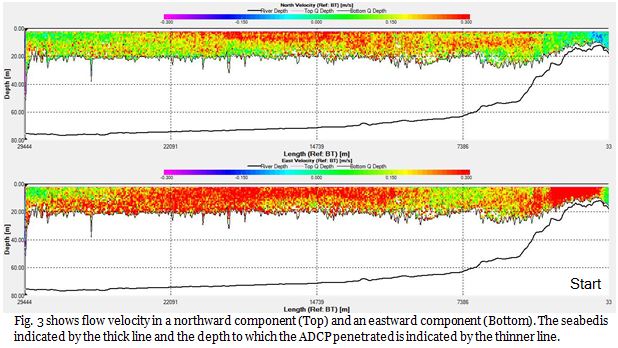
Fig.3
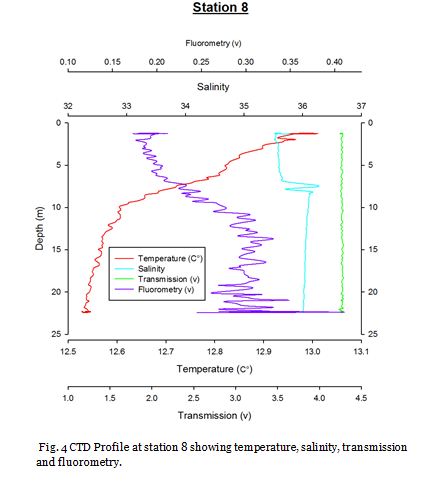
Fig.4
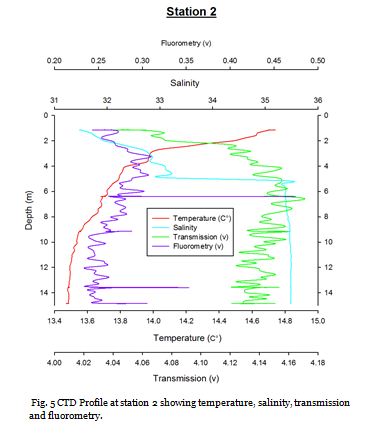
Fig.5
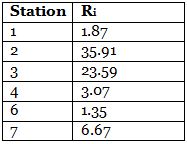
Table 1

The aim of the offshore survey was to observe the changes in stratification due to
vertical mixing, how this changed as the tidal mixing front was crossed and the consequent
direct and indirect effects on phytoplankton and zooplankton community structure.
To allow this objective to be studied a survey was devised in which an inshore-
At each of the stations we visited, a series of tasks were carried out. These are as follows:
- Determination of current speed and direction -
This was carried out using an ADCP (Acoustic Doppler Current Profiler). The ADCP transects were separated into those carried out whilst the RV was in transit between stations and those carried out at the stations, resulting in 11 transects over the course of the day. - Depth profiling -
A CTD with a fluorometer attachment was lowered via a motorised winch from the surface to a few metres above the seabed in order to produce depth profiles of temperature, salinity, irradiance and chlorophyll concentration throughout the entire water column. Following this, the CTD was brought back to the surface, stopping at intervals in order to obtain water column samples. - Water column sampling -
It was decided to take samples of water at interesting layers in the water column, such as the deep chlorophyll maximum, using Niskin bottles attached to the CTD rosette system. These regions were pre- determined whilst the CTD was at its maximum depth, by analysing the profiles it created and noting potential sampling regions. The sampling was then carried out during the CTD ascension, with it stopping at the desired depth to allow for the capture of water samples. Some samples were then analysed in the laboratory to determine concentrations of nitrate, phosphate, silicate, dissolved oxygen and chlorophyll, whilst others were preserved with iodine in order to carry out a plankton count in the lab. - Secchi disk -
An estimation of the euphotic depth was carried out via the use of a secchi disk. At each station, the secchi disk was lowered and the depth it was no longer visible was recorded. - Plankton netting -
Nets were lowered via a winch system to a predetermined depth. They were then opened and trawled upwards through the deep chlorophyll maximum to a shallower depth, before being closed and brought back onboard. At some stations there were problems with the net closing; in these cases a secondary net was released from the lower depth to the surface in order to be used as a comparison.
Copepods (from nauplii to adults) dominated the zooplankton community at stations
1-
Zooplankton are known to exhibit evident seasonality in abundance and community structuring (Calbet et al. 2001). The dominance of copepods at the majority of the sampling stations was not surprising as they are known to be the most abundant metazoans in the ocean (Davis et al. 1999), providing an important trophic link between classical and microbial food webs (Roff et al., 1995; Wickham, 1995, Calbet et al, 2000).
The medusa present in the station 7 samples coagulated most of the sample within their nematocysts, rendering most of the sample unobservable and could explain the unusually low copepod abundance at that particular station.
Acquisition of time series data, such as that gathered by the Western Channel Observatory, has long been the primary means of quantifying and monitoring plankton community dynamics. Ultimately, the samples obtained in this study are a tiny snapshot of the entire zooplankton community and the conclusions that can be drawn from this data are limited. Identification was carried out by a team with a differential level of identification experience. As a result, the veracity of the recordings can be called into question and interpretation should be taken with caution. Whilst this study has confirmed high copepod abundance at the majority of stations along the transect, the precise community structure remains unclear.
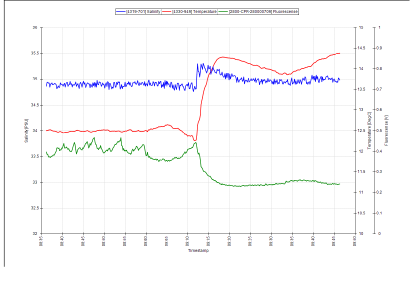
Fig.1 Screenshot of thermosalinigraph output showing the tidal mixing front at location 50o07.468N, 4o58.404w, #09:15 UTC. Click on image to enlarge
ADCP
From Fig. 4, it is evident that in the surface waters there are zones of particularly intense backscatter, indicated by the red patches in the shallow depths, where backscatter is in excess of 85db. It is apparent that these zones of intense backscatter become more prolific and deeper with increasing distance offshore.
In the sub-
At approximately 22,000m into the transect at depth of 18-
This transect was taken during just one of the many legs of the ships journey. Flow is almost uniform in direction and magnitude across the entire transect (Fig.2 & 3). Other ADCP transects were taken in between sampling stations throughout the course of the rest of the survey. By comparing these to this initial transect, we can see how flow changes throughout the course of the day along this axis. Fig. 5 shows flow after sampling at station 2, at the start of the ship track flow appears to be more random than before, and during this transect flow establishes itself, this time flowing in the opposite direction to before. This flow remains established across all other transects taken. This is flow pattern is reflective of the tidal cycle, with the initial flow towards the north east being the flood tide, and the south west flow being the ebb tide.
Richardson number (table 1) defines a ratio of stabilizing forces, gravity and density gradients versus the inertial flow forces and provides a measure of flow laminarisation (Galperin et al. 2007). It can be used to characterise the nature of a flow at a given point. Where shear flow is high relative to the stabilising forces of the density gradient, Richardson number is low, the water has enough energy from the shear flow to overcome the density gradient and mixing can occur. Where the water is strongly stratified relative to the shear flow, Richardson number is high, and water does not have the energy to overcome the density gradients. In all cases in the offshore survey, stratifying forces dominate the shear forces, which is reflected by high Richardson numbers.
All stations offshore showed minimal shear relative to the density gradient. The water is stratified and this stratification is capable of inhibiting mixing. Where Ri is low, such as stations 1 and 6, there is stronger shear and weaker stratification, so mixing is stronger
Chemical and Phytoplankton analysis
Station One (fig. 6 -
Surface waters of station 1 show fairly high concentrations of nitrate and phosphate (8.98µM and 0.35µM respectively) approximately follows the Redfield ratio of N:P = 16N:1P. Dissolved silicon (1.09µM), chlorophyll (1.55mg/L) and percentage oxygen saturation (110.6%) were all low. Between the surface waters and 10.5m nitrate and oxygen saturation remain fairly stable. The phosphate concentration shows a small decrease whilst dissolved silicon and chlorophyll concentrations increase massively. This suggests that phytoplankton in the surface waters are limited by dissolved silicon, and as this increases with depth. The chlorophyll concentration increases proportionally, indicating that the phytoplankton population is primarily diatoms. This is supported by the count data which indicates large numbers of the diatom Rhizolsolenia alataz (250cells/ml). Figure 6 shows fairly constant temperature (~12.31oC) and salinities (~35.15) throughout the water column, suggesting that the water column is well mixed. This further supports diatom populations and helps explain the lack of dinoflagellates. Below 10.5m chlorophyll concentration reduces as light becomes limiting to phytoplankton growth. This is shown by low levels of PAR (28.80), observed at 18.69m.
Station Two (fig. 9 -
A strong thermocline is seen between 20-
Station Three (fig. 12 -
Figure 12 displays a clear thermocline present at ~20m. Nutrient concentrations in the upper mixed layer are low and a deep chlorophyll maxima (DCM) is seen at the thermocline. At the DCM, nitrate decreases further while phosphate increases relative to the surface water, suggesting nitrate is removed at a greater rate. This indicates the presence of dinoflagellates as they tend to have higher N:P ratios and are commonly present in stratified waters. Decreasing dissolved silicon suggest the presence of diatoms in this DCM. This is supported by the cell count data which showed high abundances of both the dinoflagellate Karinia mikimotoi (100cells/ml), and diatoms, Nitschia (160cells/ml) and Coscinodiscus (130cells/ml). Below this DCM, chlorophyll decreases rapidly, while nutrients increase. PAR lower than 16.85 was observed at 30m and below and therefore production below the DCM is likely to be limited by light.
Station Four (fig. 15 -
Figure 16 shows that the surface waters at station four contain the lowest concentrations of nitrate, dissolved silicon and phosphate of 8.62µM, 0.15µM and 0.01µM respectively. Nitrate is seemingly homogenous down to depths of 15.10m and dissolved silicon and phosphate concentrations only increase slightly. Chlorophyll concentration is reasonably high in the surface waters and decreases towards 15.10m. This indicates a surface bloom which has utilised the nutrients as when chlorophyll concentrations fall an increase in nutrients is then observed. Phosphate and dissolved silicon concentrations remain fairly low at 21.52m. Figure 15 shows strong stratification and a deep chlorophyll maximum is clearly visible at this point. This DCM consists of large numbers of Nitschia and Karenia mikimotoi. The presence of these phytoplankton blooms results in high dissolved oxygen (122.7%) in the surface mixed layer. Below this DCM chlorophyll decreases rapidly, while nutrients increase indicating light limitation.
Station Five (fig. 18 -
Figure 19 shows that phosphate, dissolved silicon and chlorophyll concentrations
were fairly low in the surface waters and nitrate and oxygen saturation were high
at 10.05µM and 116.7% respectively. At 13m nitrate is significantly lower (8.84 µM),
and phosphate and silicon also decrease further. Chlorophyll decreases correspondingly.
At 25m a deep chlorophyll maximum (4.40mgL-
Station Six (fig. 21 -
Figure 22 shows that nitrate, dissolved silicon and chlorophyll increase in concentration
from 0.66m to 14.77m. It also shows that phosphate and percentage oxygen saturation
decrease with depth to 0.07µM and 110.1% respectively. This suggests that nitrate
and dissolved silicon limit phytoplankton growth in the surface waters and then as
nutrient concentrations increase with depth it leads to more favourable conditions
for phytoplankton growth and this is supported by the increase in chlorophyll observed.
Figure 21 shows a thermocline with a decrease in temperature from 13.36oC to 12.42oC
at 2.8m -
Station Seven (fig. 24 -
Figure 24 shows no major thermocline, and figure 25 shows that chlorophyll concentrations
are greatest at the surface at 4.00mgL-
Click on figures to enlarge
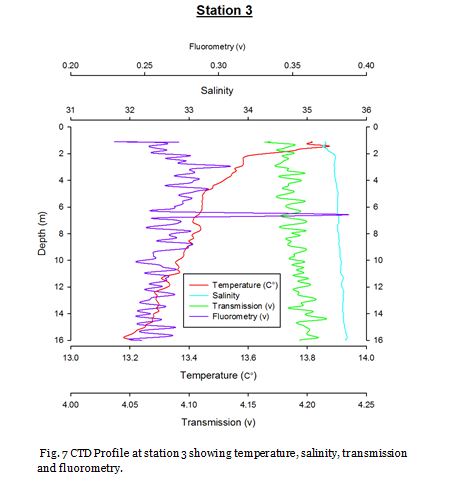
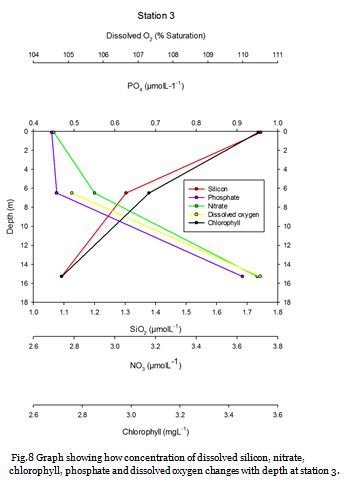
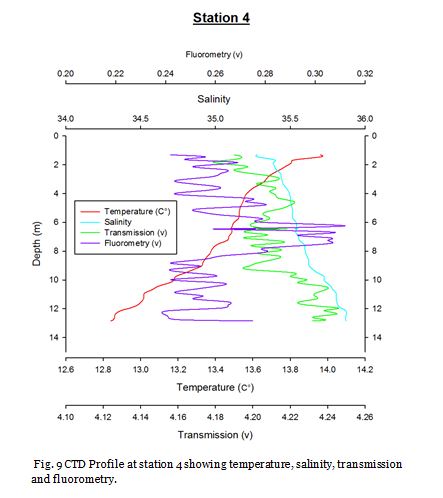
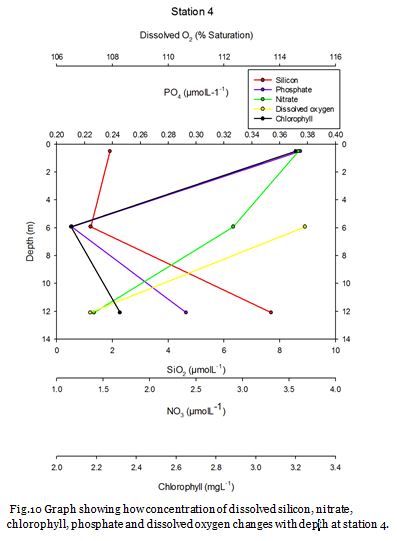
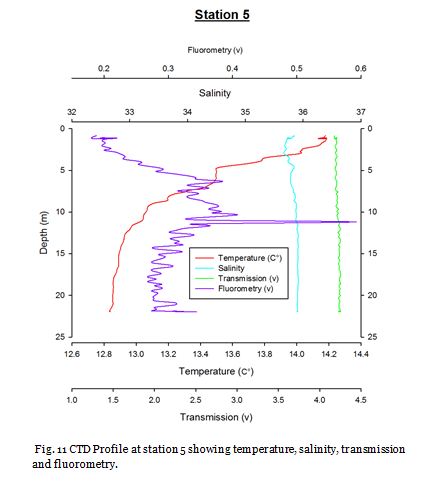
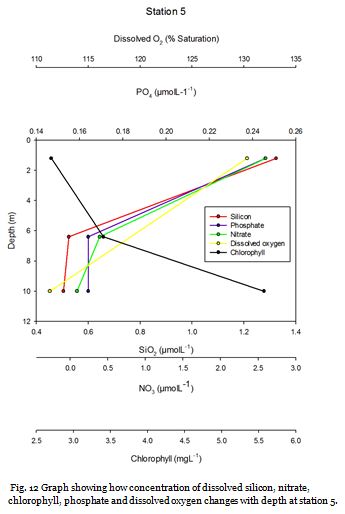
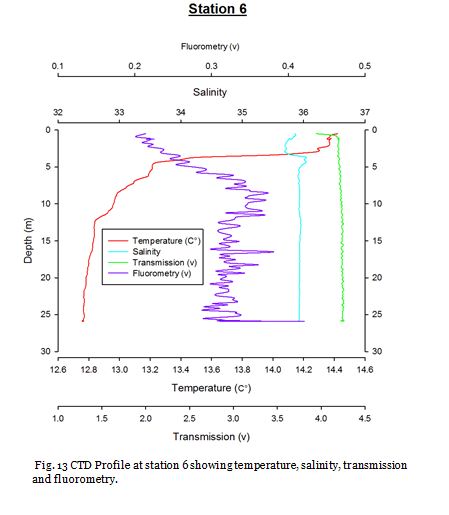
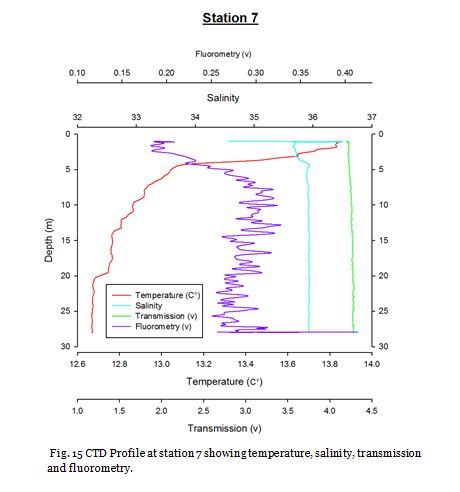
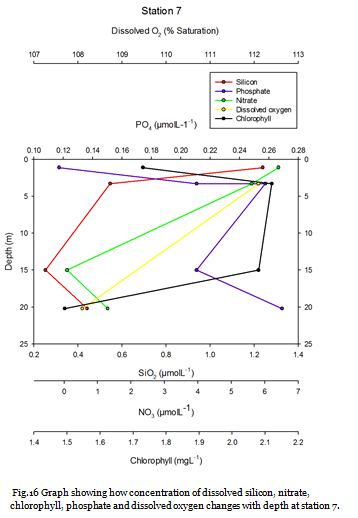
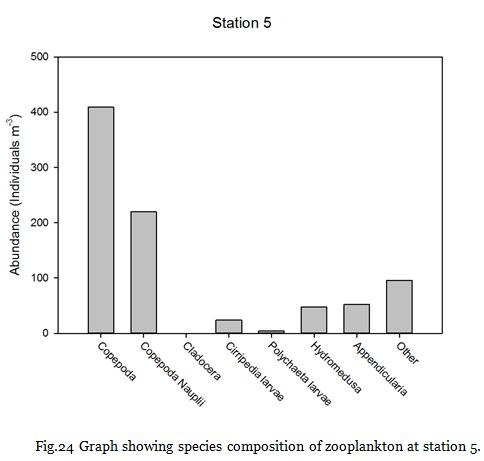
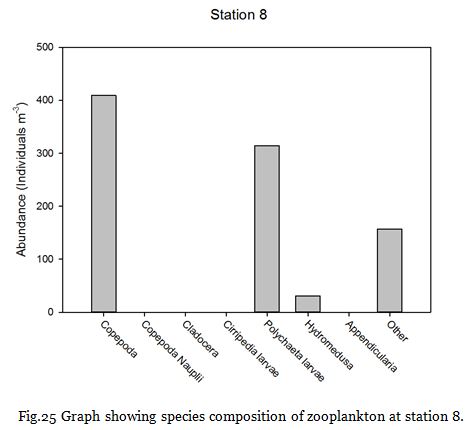
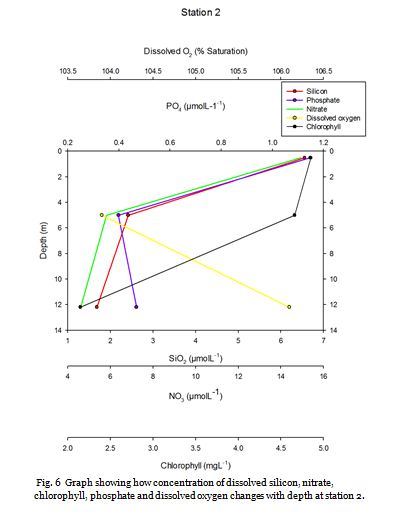
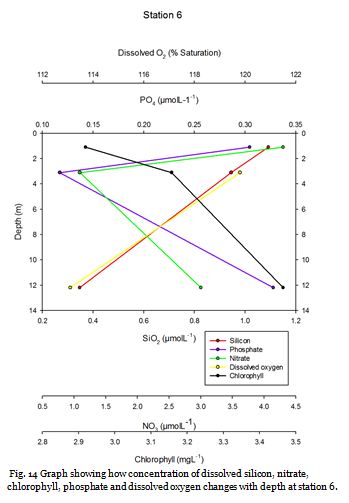
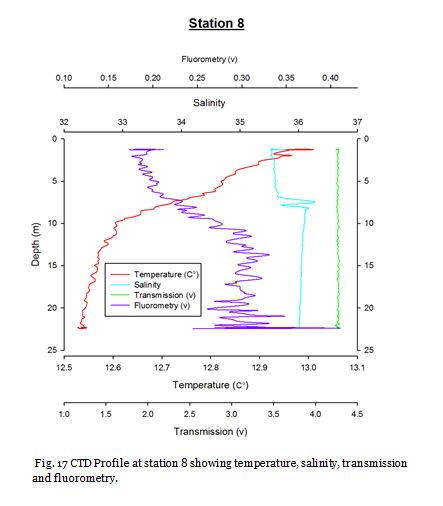
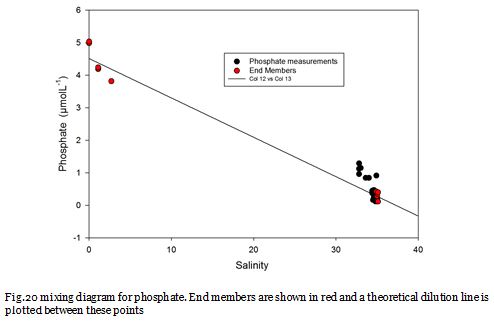
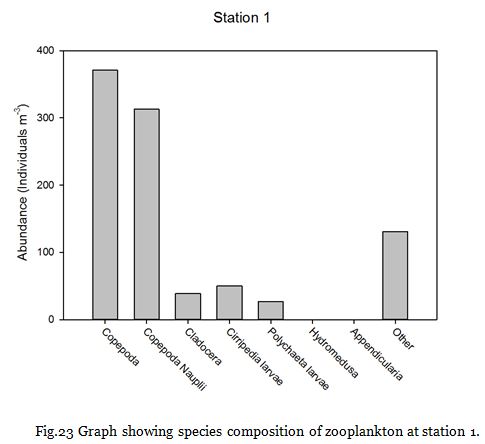
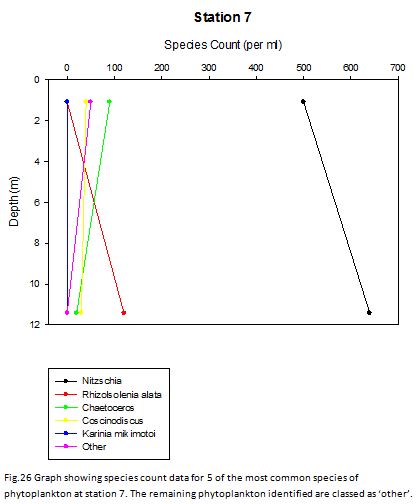
Fig. 6
Fig. 7
Fig. 8
Fig. 9
Fig. 10
Fig. 11
Fig. 12
Fig. 13
Fig. 14
Fig. 15
Fig. 16
Fig. 17
Fig. 18
Fig. 19
Fig. 20
Fig. 21
Fig. 22
Fig. 23
Fig. 24
Fig. 25
Fig. 26
Click on image to enlarge
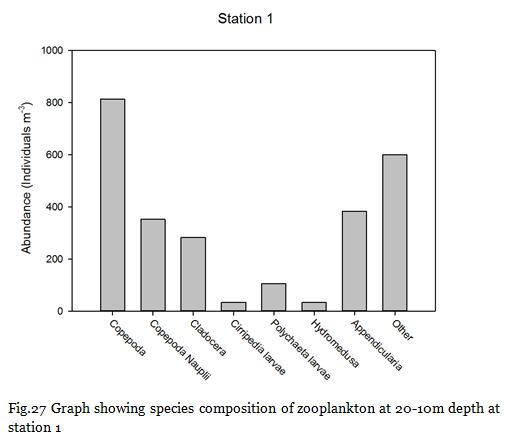
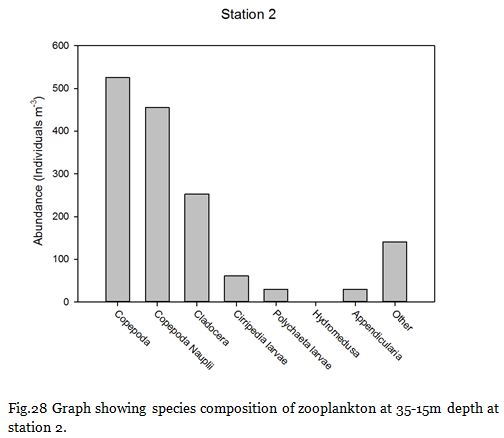
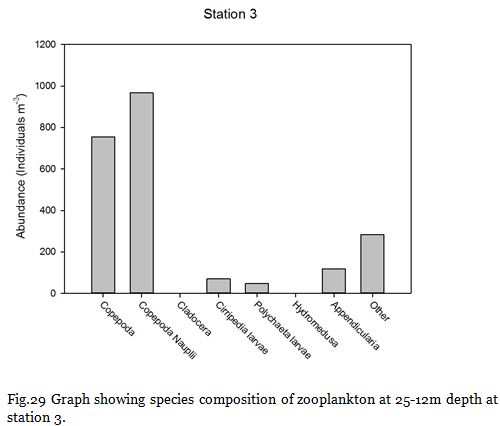
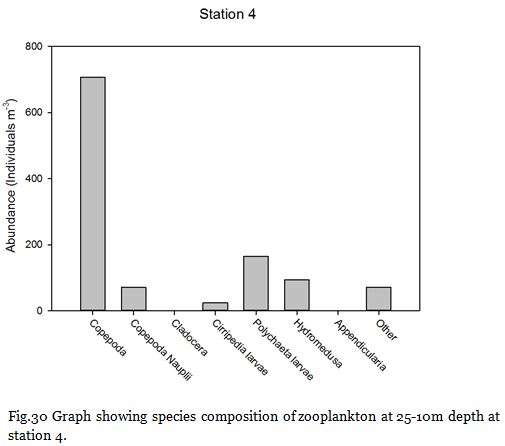
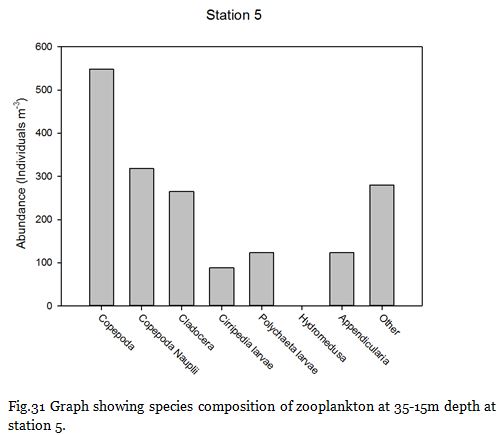
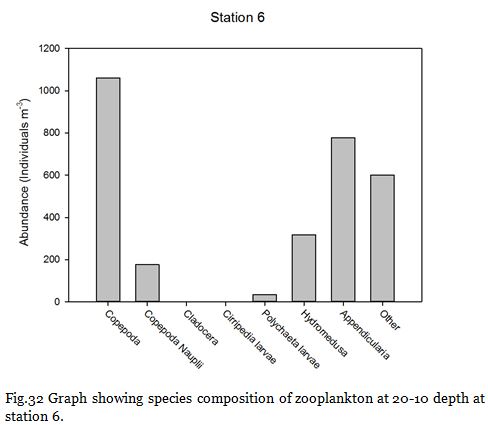
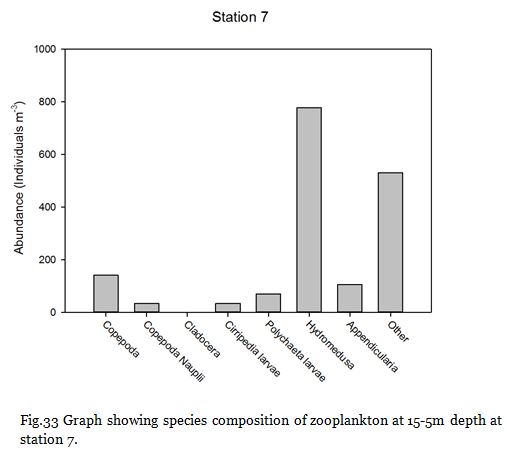
Fig. 27
Fig. 28
Fig. 29
Fig. 30
Fig. 31
Fig. 32
Fig. 33
Disclaimer: The opinions and conclusions expressed in this website are not affiliated with those of the National Oceanography Centre or the University of Southampton.
| Introduction |
| Methodology |
| Physical analysis |
| Chemical and phytoplankton |
| Zooplankton |
| Introduction |
| Methodology |
| Side-scan |
| video transect |
| Limitations |
| Poster |
| Introduction |
| Methodology |
| Results |
| Limitations |
| Introduction |
| Methodology |
| Physical analysis |
| Chemical analysis |
| Biological analysis |
| Limitations |