Group 2 Plymouth Field Course

HABITAT MAPPING
GEOPHYSICAL SURVEY
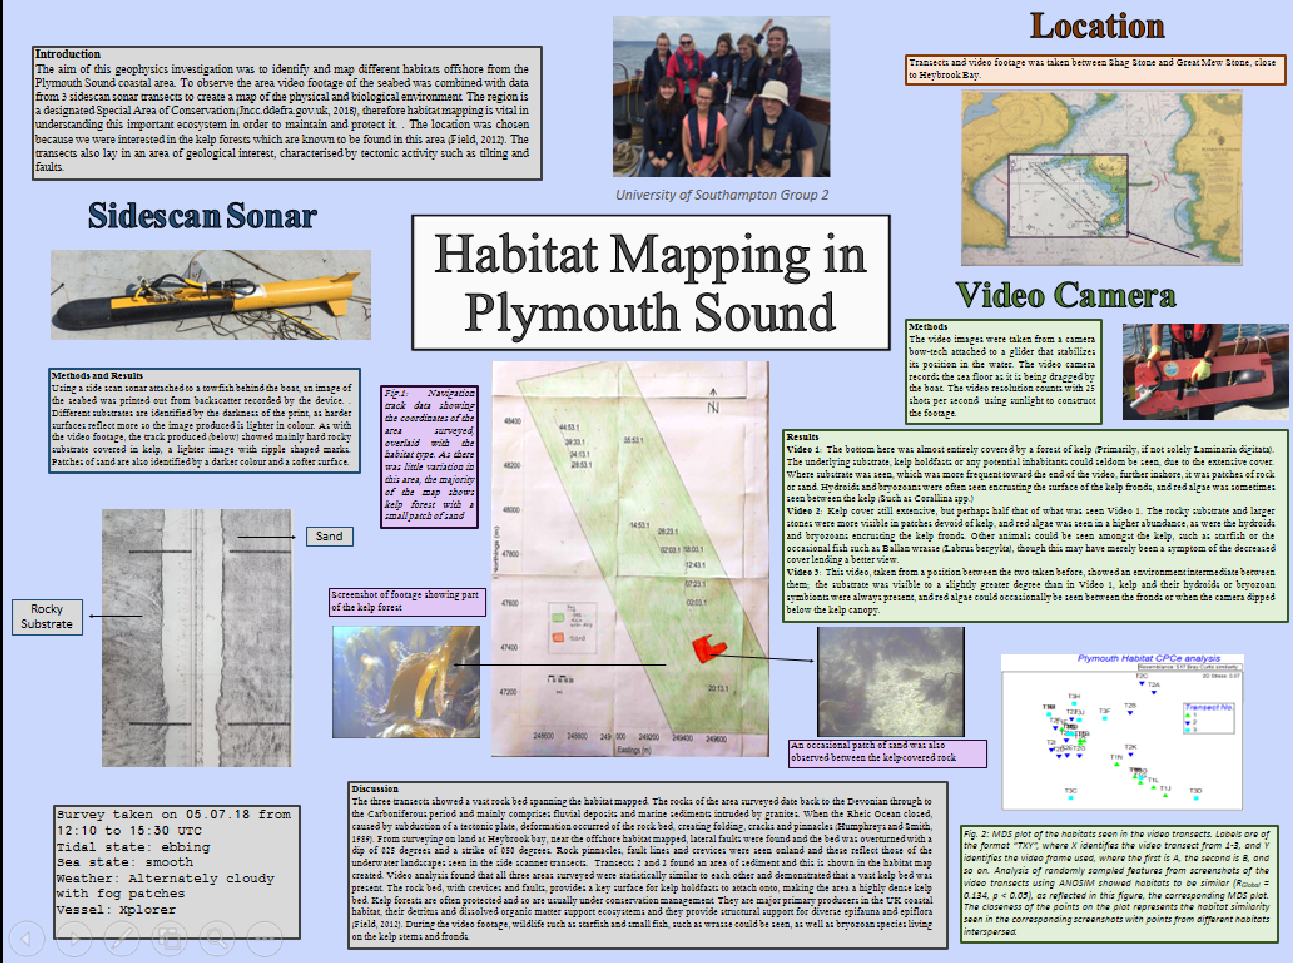
On Thursday 5th July, we went on the Explorer to survey the habitat and substrate of the area shown below. Our group chose this area as looking at previous reports and habitat maps of the Plymouth area suggested that this area was full of kelp forests. We believed that would be an interesting area to survey and the tides and conditions on our day of surveying were favourable for this area. The most common wind direction in Plymouth is North Easterly, meaning the area we surveyed experiences a large amount of wind and wave action, we were interested to see how this has affected the habitat. Upon reaching the site, we performed three side scan sonar tracks in a roughly rectangular shape. From the sonar images we determined the substrate to be bedrock with kelp and some sand patches. To ground truth this, we then used optical imaging to video three tracks crossing through the side scan tracks (shown in the habitat map below). From the video recorded we found there to be large amounts of kelp anchored on bedrock with some small patches of sand. The next day, we used the data collected to produce our own habitat map of the area and to perform similarity analysis between the three different areas of video recording. Our results are presented here in a Geophysical Poster.
GEOPHYSICS SURVEY

Field Trip to Heybrook Bay and Renney Rocks on Friday 6th July. We walked around
Heybrook bay and Renney Rocks -
The rocks found in the Renney Rock formation area are medium to thin bedded alluvial sandstones and mudstones, deformed by folding and faulting.
In pairs, we took readings of different rock faces strike and dip and then analysed the different sediment layers of the exposed cliff face.
We found an overturning fault and analysed the movement of the rocks via the distance between fault lines.
From the sediment layers, we saw evidence of riverine transport in the lower layer, followed by a layer of red clay, followed by a layer of sediment deposited due to turbulent flow after a glacial period. The top layer shows evidence of more erosion.
The views and opinions expressed are those of the individual and not representative of the University of Southampton or the National Oceanography Centre.

Fig 2 -
