
FALMOUTH FIELDCOURSE
Group 5
The views expressed are those of the individuals concerned and do not express the views of the University of Southampton or those of the National Oceanography Centre Southampton.

Biological data
The biology of the water column was tested by counting and identifying the phytoplankton and the zooplankton present at varying depths and locations.
Phytoplankton cell count was measured using a 1ml sample of the 100ml seawater sample collected. This was placed on a Sedgewick rafter cell with engraved squares. The number and species of phytoplankton in 100 squared were counted.
The zooplankton was measured using the a 10ml sample of the 1L sample collected. This was put into a Bogorov chamber and the number and type of zooplankton were counted. These were then converted to the number per volume of water sampled using the following equations.
πr2L = V and (nx100)/V = N
Chlorophyll concentration was measured using a fluorometer. The acetone with filter paper was frozen over night as an alternative to sonicating the sample. Once in the lab the acetone was poured into a tube and the µg/L of acetone was measured using a fluorometer. This was converted to µg/L of seawater using µg/L acetone x (6/100).
The concentration and location of plankton depends on the stratification of the water as this will affect the location of the nutrients.

Above: Microscope for identification of zooplankton samples
(Photo credit -
Click below to see our biological data from offshore and the pontoon at King Harry Ferry
Click below for more data from the estuary
Phytoplankton
There is a clear transition in the phytoplankton species between the stations along
the Fal Estuary from black rock to King Harry Ferry. Species found in multiple stations
can only be seen at stations 37 and 38, the two stations located closest to the marine
source of the estuary. There is a spike found for Nitschia sp. (Since this spike
has been found in numerous graphs, it may be considered that it was misidentified
as a Nitschia sp and not that of Pseudo-
Zooplankton
Like that of offshore, Copepoda dominates the sites between Black Rock and King Henry Ferry, with very few other species present. There is a clear difference between station 37 and 38 with equal number of species discovered but only two overlapping species of Copepoda and Gastropod Larvae (barnacles). Barnacles are sessile organisms that require rock surfaces to settle. Their abundance within the sample may be natural influences of the tide and their pelagic phase as larvae prior to settlement.


Phytoplankton
Station 1 had both the highest number of species identified and the largest abundance
of organisms, with Eucampia being found to be the dominant species. There are species
that can be found in station 2 and 3 that are not found at station 1 (like the samples
collected on the Conway). Similarly, there are no species found at station 1 that
are found in either of the two other stations. Its is interesting to note that the
abundance of organisms and the biodiversity decreases towards the freshwater input,
suggesting the number of marine species are decreasing with each station. It should
also be noted that during the sampling the tide was beginning to come in -
Zooplankton
Chlorophyll
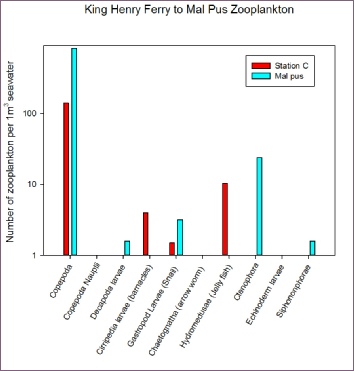
Sites between King Henry Ferry and Malpas, zooplankton analysis had to be log transformed due to the vast quantity of Copepoda (once again dominant species) found over that of the other zooplankton species. There are no clear distinctions between that of station C and Malpas. An outlier that should be noted would be: Malpas was the first time in the whole analysis of the zooplankton samples (Excluding station C8 in Offshore analysis) Ctenophora (The comb Jelly fish) was discovered. Since it was found so close to the fresh water input of the sites measured, and being unable to control its position vertically in the water column the discovery of the Combed jellyfish may have been an influence of the incoming tide bring the species this far up the Fal estuary.
The Winnie the Pooh chlorophyll concentration was measured at the surface for 4 sites. Site 1 was located near a tributary, the chlorophyll concentration at this site is relatively low. Site 2 was further upstream, the chlorophyll concentration is slightly increased, this could be due to the increase in nutrients from terrestrial systems creating favourable conditions for phytoplankton. Site 3 was near a sewage treatment plant, the sewage outfall produced would have a high nutrient concentration. This large nutrient input allows phytoplankton to become highly productive, increasing their numbers in surface waters, and therefore increasing the chlorophyll concentration. Site 4 was located close to the pontoon and King Harry Ferry, the chlorophyll concentration here is relatively high, but variable.

Click to expand

Chlorophyll
Station 37:
The chlorophyll concentration at the surface is relatively high, this then decreases with depth to 10m. The chlorophyll concentration then increases at the at the bottom. Large error bars suggest that the data is not accurate and therefore that the patterns shown in the graph may not be representative of the actual chlorophyll distribution throughout the water column.
Station 38:
The chlorophyll concentration at station 38 increased slight with depth, this is reflected in the CTD data. The error bars from the measurements at this station increase in size as depth increases, this makes the actual chlorophyll distribution difficult to determine.
Station 39:
The chlorophyll concentration at station 40 decreases with depth to ~13m, at this point it begins to increase sharply to about 17m. Again, the error bars make the accuracy of the results difficult to establish, the actual chlorophyll concentration could be dramatically different to those shown in the graph.
Station 40:
The chlorophyll concentration at station 40 is relatively low at the surface, this then increases with depth to ~8m. After this point in decreases again with increasing depth. The surface error bar for this site is very large making assumptions of the surface chlorophyll concentration difficult.


Click each graph to expand
Click each graph to ex