
Offshore Physics


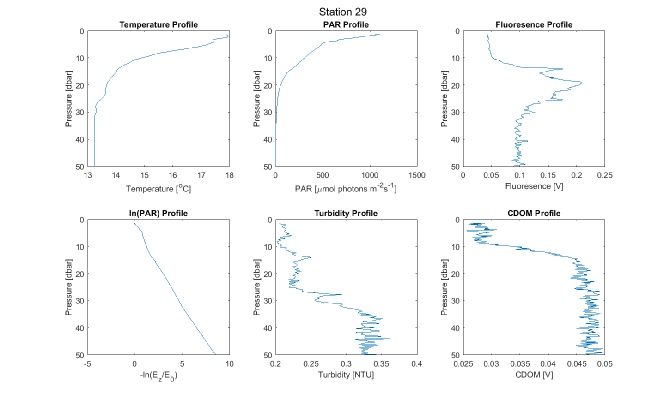
Temperature stratification is seen at all stations, with a temperature difference of 4-5oC seen between the upper and lower layers. The temperature of lower layer is around 13oC at all stations, and the upper layer is around 17-18oC. The thermocline is located at approximately 10-20m at all stations apart from stations C26 and C29. These stations are located further inshore than the other stations leading to a shallower water column which consequently pushes the thermocline up towards the surface (the thermocline is located at 5-10m at these stations).
There is little variation in salinity between the stations. Salinity in the surface layers is approximately 35.3 and increases slightly below the thermocline to 35.4 at all stations. At all stations, density increases with depth indicating that the water column is statically stable.

There is little variation in the profiles of PAR (photosynthetically active radiation) between stations. The light attenuation coefficient, K, and 1% light depth are almost identical for stations C25-C28. The graph of ln(Ez/E0) for station C26 is not linear. The gradient in the first section of the graph is shallower, which would lead to a lower value of K, indicating that there is less light attenuated per metre in the surface 5m than at depth. This could be due to inhomogeneities in the water column, for example the higher levels of CDOM (coloured dissolved organic matter) at depth. This could also just be a feature of the surface irradiance changing whilst the profile was being done as the surface irradiance was not measured continuously.
There is a chlorophyll maximum at depth in all profiles, the location of this maximum varies between the stations. There is a very clear spike in fluoresence at all stations apart from station C26, where fluorescence remains high from 20m to the bottom of the water column (30m). At stations C25 and C27 the DCM is located between 30-40m and at C28 it is located between 25-38m. The water depth at all of these locations was approximately 60m. Stations C26 and C29 are both located further inshore and have water depths of around 30m and 50m respectively. The thermocline is consequently pushed up and is shallower at these locations. A corresponding decrease in the depth of the DCM is seen, with it located at 20-30m at C29 and 15-25m at C26.
The formation of the DCM is due to a number of processes. As solar irradiance increases towards summer, thermal stratification increases and phytoplankton are trapped in the surface mixed layer where there are both sufficient nutrients and light for growth. This leads to a spring bloom which dies off when nutrients become depleted in the surface mixed layer above the thermocline. Although the strong thermal stratification stops nutrients from being mixed up into the surface layer there are still high nutrients around and below the thermocline. During summer, there is also sufficient light here for phytoplankton growth & deep chlorophyll maximums form. The deep chlorophyll maximums found during the survey are all found below the thermocline but above the 1% light level where there is both sufficient light and nutrients for phytoplankton to thrive.
CTD
ADCP
Transects of flow and direction were undertaken throughout the offshore survey using the Acoustic Doppler Current Profiler. The transects were taken both between and at each stations. In each transect the flow is generally fastest at the surface decreasing fairly uniformly with depth. On each profile there is a distinct benthic boundary layer where the flow velocities decelerate to the lowest values due to frictional processes with the seafloor. The highest flow rates of roughly 0.8 m/s are found at areas of shallow depth such as that found at station 19 (figure 1). Due to mass conservation, if depth decreases the flow speed must increase for the same amount of water to pass a certain point. This is confirmed as the flow generally reduces with an increase in depth offshore.
Through the tidal cycle, the maximum rates of tidally induced flow can be expected at mid flood and mid ebb tide. This was seen at stations C27 and C28 with flow rates of roughly 0.5 and 0.4 m/s respectively taking into account the expected lag in tidal states between the station and Falmouth. The flow at each site also varies in direction with the turning tidal state. A slight change in direction was seen from 200° at station C25 during an ebbing tide changing to 270° at station C29 on the flooding tide. The ADCP transect at station C26 was not collected adequately and therefore the ADCP and Richardson number for this site are not included.

C25 ADCP transect
Station C28 ADCP transect


Ship track station C28.
Richardson Number
The Richardson numbers were calculated from velocity values extracted from the ADCP transects and density values taken from the CTD profiles at each station using Equation 1. Below 0.25 the water column is expected to be mixed with the Richardson number dominating by velocity shear. Above 1 a laminar column is anticipated (Galperin et al., 2007), with the Richardson number dictated by static stability and buoyancy. For Richardson numbers above 10 the values were limited.

Equation 1. Richardson number equation.


At stations C25, C29 and C28 there is a defined peak in Richardson number at the surface showing laminar water columns. As shown on the corresponding density profiles, the laminar flows at the surface are most likely due to large stratification in density and buoyancy caused by the seasonal thermocline. Below roughly 20 meters on each profile the water column oscillates between laminar and turbulent. The laminar flows at depth are expected due to low density stratification below the seasonal thermocline meaning strong velocity shears will dictate the Richardson numbers.
Reference
Galperin, B., Sukoriansky, S. and Anderson, P.S., 2007, On the Critical Richardson Number in Stably Stratified Turbulence. Atmospheric Science Letters, 8, 65-69.

Disclaimer: The views and opinions expressed in this site are solely those of Group 13 and not necessarily the University of Southampton or the National Oceanography Centre, Southampton.
| About Us |
| Biology |
| Chemistry |
| Physics |
| Results |
| Biology |
| Chemistry |
| Physics |