


Date: 8th July 2017
Time: 8:00 UTC to 11:00 UTC
Weather: calm sea – 7/8 cloud coverage
Wind: S SE 7 m/h
Location: 50°12’ 58.071 N
05°01’ 40.893 W
Tide High: 4:39 UTC – 16:57 UTC
Low: 11:08 UTC
Aim:
The aims of collecting data on the pontoon was to investigate the changes in the current, the water quality, the chlorophyll concentration and changes in temperature and salinity over time. Data had been collected at a single location every hour. This produced a time series for a fixed location.


Physics:
YSI:
The EXO 2 sonde multiparameter probe was used to collect measurements of depth, temperature, % oxygen saturation, salinity, pH, turbidity, and chlorophyll concentration. The probe was deployed off the side of the pontoon, and was held just below the surface to allow the sensors to adjust to the water. Data was recorded at meter intervals, with 30 minutes between the last reading from one station to the first reading of the next.
Current meter:
The current meter was attached via a cable to a display screen and the aim was to measure the speed and direction of flow of water at the varying states of the tide throughout the morning. The depth of water was established from the YSI readings and the flow meter was deployed to measure the speed and direction of flow at the surface and at several depths depending on the state of the tide.
Light meter:
The Li-
Chemistry:
The Niskin bottle from General Oceanics INC was deployed off the side of the pontoon by hand, and samples were collected every hour, or every other station. Samples were collected once just below the surface and again at 50 cm above the estuary bed, to give a buffer against any turbidity stirred up from the benthos which may have contaminated the sample. As the tide was ebbing during the collection frame, the deep water depth varied depending on the station, getting generally shallower as the tide ebbed.
Biology:
Chlorophyll:
The aim of collecting data was to investigate how chlorophyll changes over a changing tide.
A 60ml syringe was cleaned with 60ml of the seawater sample under testing and the water discarded overboard. 50ml of the seawater sample was then taken from the original sample bottle and a 0.2μm filter of 25mm diameter attached to the syringe to retain the organic matter from the extracted subsample. The filter paper was then removed, transferred and sealed in a test tube containing 90% acetone to form a lysate solution. These tubes were then later analysed in the lab using a fluorometer.
Lab analysis:
Chlorophyll samples taken from the previous day and were placed into a glass tube
and measured for fluorescence using a 10AU-

Current meter:
Results:
Station Time (UTC) Depth Speed (m/s) Direction
Station 1 08:34 Surface 0.066 188.8
Station 1 08:35 1 0.108 181.5
Station 1 08:35 2 0.227 186.5
Station
1 08:36 3 0.208 172.1
Station 1 08:36 4 0.147 173.1
Station 3 09:38 surface 0.067 179
Station
3 09:39 1 0.11 171.3
Station 3 09:40 2 0.158 171.4
Station 3 09:40 3 0.124 179.4
Station
5 10:32 surface 0.037 168.9
Station 5 10:32 1 0.043 164.7
Station 5 10:33 2 0.064 175.4
Station
5 10:33 2.8 0.013 118.9

Photograph of the current meter used on the Pontoon
The flow observed over this part of the tidal cycle reflects the ebbing tide and proximity to low tide. The speed and direction of flow observed appears to reduce over the time the data was collected and this would be consistent with approaching low tide. The speed of flow increases from the surface before reducing at depth. The direction of flow also changes over depth with the largest effect being seen at station 5. This station was approximately half an hour before low tide and had the slowest flow, reflecting the onset of slack water. Bottom shear and slowing flow increasingly affected the direction of flow at the bottom over time. The speed of flow at the surface also appears to have been affected by the boundary layer, showing reduced flow with increasing flow away from the boundary.
Light Sensor
Station 5 has a higher surface irradiance compared to station 1 and 3. This is as the surface water has received more solar energy. Due to limited readings being taken a full trend between each station is hard to extrapolate, however light attenuation coefficients of 0.41, 0.55 and 0.52 respectively. This is surprising as you would expect to see more light being able to attenuate later in the day. Light intensity is high in this area as there is little turbidity, with little excess deposition into the estuarine system. Also past conditions of calm weather means there has been little mechanical mixing.

Figure 27. Graph showing light propagation on the pontoon
YSI Depth profiles

From figure 28 it was evident that there was an overall negative correlation between depth and temperature in the fact that, with increasing depth, the temperature decreased. This was most evident at station 3 where, 0.5m below the surface, the temperature was 17.25°C before it declined by 0.45°C to 16.8°C at 3.5m deep. With the exclusion of station 1, there is an overall increase in temperature across the stations. For example, station 2 experienced a range from 16.9°C to 17.1°C, whereas station 5 experienced 17.6°C to 17.8°C. This significant change in range could be due to the fact that station 5 data was taken later in the day and thus temporal factors have affected the average ambient atmospheric and aquatic temperature. The anomaly here was station 1, which experienced an inclusive higher temperature range than station 2. Tidal effects, inclusive of shallow water mixing, are not relevant here as stations 1 and 2 were recorded consecutively, with minimal time delay for noticeable effect and therefore it could be concluded that this was an anomalous.
Figure 28. Temperature depth profile taken at the pontoon.

Figure 29. Salinity depth profiles over time taken at the pontton.
From figure 29. it was evident that there was an overall positive correlation between depth and salinity in the fact that, with increasing depth, the salinity increased; and this was expected due to the fact saline water is denser than freshwater and sinks; whose instability affects mixing and turbidity in the water column. This was most evident at station 5, where the salinity was 33.48 at 0.5m and sharply increased to 33.69 at 3.0m depth. When analysed with temperature, it was evident that there was a simultaneous, correlative, relationship in the fact that global increases in salinity were directly proportional to increase in temperature across stations 2 to 5. For example, station 2 experienced a range from 33.85 to 33.95, whereas station 5 experienced 33.48 to 33.69. This significant change in range could be due the directly proportional relationship with salinity. As a result of this coupling, it was determined that station 1 was also anomalous as there was no justifiable physical evidence to account for this.

Figure 30. Turbidity depth profiles over time taken at the pontoon.
From figure 30 it was evident that, with the exclusions of anomalies, the turbidity remained relatively constant throughout stations 1 to 5; remaining within the range of 1.0 to 1.5. At station 2, there was a small peak in turbidity from 1.0 to 1.5. With respect to tidal influences and the location of the pontoon, the tide was receding and inputs from the confluence before King Harry Ferry contributed to the increase in freshwater flux of the river at this time, which would have created instability in salinity and mixing as a result at this depth. At station 3, it was evident that an anomalous extreme peak in turbidity occurred from 1.0 at 1m to 4.0 at 2m, before steeply decreasing again to 1.0 at 3.5m.. This extreme peak was due to a passing vessel that caused a sudden disturbance in water movement. This was also the instance at 0.5m deep at station 4.

YSI Depth profiles YSI contour plot analysis
Figure 31. Temperature contour plot of the changing tide from the data collected on the YSI probe.
The contour plot shows temperature changes over time and depth on the pontoon of River Fal. The tide was in ebb, with high tide at 04:37 UTC and low tide at 11:00 UTC, so the depths data could be collected at became shallower over time (figure 1). There are clear temperature shifts as the tide goes out, with warmer fresh water being drawn down the estuary. There is limited stratification across each station with changes in water column temperature occurring over the whole column rather than across layers, showing the estuary is well mixed (Masselink et al 2003)

Disclaimer: The views and opinions expressed are those of the contributors and do not reflect the views and opinions of the University of Southampton
Masselink, G., Hughes, M. G. & Knight, J., 2003. Coastal Processes & Geomorphology 2nd ed. Hodder Education, London
Temp (°C)

Figure 32. contour plot of salinity over time and depth collected from the pontoon.
The salinity contour plot shows a decrease in salinity with the ebbing tide, which is due to reduced saltwater intrusion in the estuary as the tide goes out. This can be clearly seen from 09:00 am onwards, however there is a general increase in salinity between the first 2 stations. This is most likely due to random fluctuations in the water column, as the tide had been in ebb since 04:00 on the day the data was collected
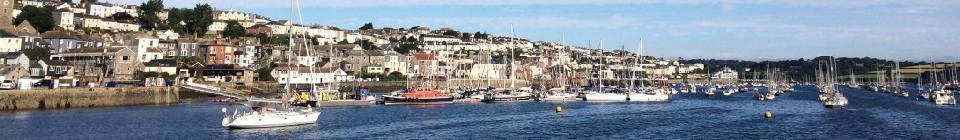
Figure 26. Map showing pontoon location in the Fal estuary
Long 50°12'58.071''N Lat 05°1'40.893''W
-