Falmouth 2016 Group 9
Niskin: A Niskin bottle was used for collecting samples for Chlorophyll analysis. Between 08:40 and 11:15 UTC at 30 minute intervals, 6 sets of samples were taken at 1 metre intervals from the surface to 6 metre bottom depth. Samples were taken by setting up the open Niskin bottle to the desired depth before using a signalling weight to close the bottle and collect the sample. This sample was then transferred to a bottle and filtered using a syringe following scientific protocol to avoid contamination, the filter paper was submerged in Acetone and frozen over night for Lab analysis the next day.
Light meter: A light meter was used to measure the change in light irradiance with
depth, between 08:40 and 11:15 UTC at 30 minute intervals, 6 sets of samples were
taken at 1 meter intervals from the surface to 6 metre bottom depth. A surface irradiance
was left on the pontoon while a probe was lowered into the water at desired depths.
From the two readings it was possible to calculate the % total surface-
Exo multiparameter probe: The Exo probe was used to measure multiple variables from
the array of sensors in the probe. Between 08:40 and 11:15 UTC at 30 minute intervals,
6 sets of samples were taken at 1 metre intervals from the surface to 6 metre bottom
depth. Once in the water, the probe gave readings on a monitor of Sonde time (UTC),
Depth (m), Temperature (°C), Salinity (PSU), Dissolved oxygen (% saturation and mg/L)
and pH. The turbidity sensor was unfortunately non-
Flow meter: The Flow meter probe was used to measure differences in flow or currents with depth. Between 08:40 and 11:15 UTC at 30 minute intervals, 6 sets of samples were taken at 1 metre intervals from the surface to 6 metre bottom depth. Once at the desired depth the speed (m/s) and direction (°) was read off a monitor.
Contents:
3. Results
A. Salinity Profile
B. Temperature Profile
C. pH Profile
D.
Dissolved Oxygen Profile
E. Current Velocity Profile
F. Chlorophyll
Profile
3. Key Findings.
Metadata:
Date: 27/06/2016
Time: 08:40-
pontoon
Lat: 50°12'58.0N,
Long: 5°01'39.5W
High tide: 09:56 UTC
low tide: 03:59 UTC
Tidal height: 4.45 m
Wind: F2 NW
Cloud: 4/8
moderate,
overcast.
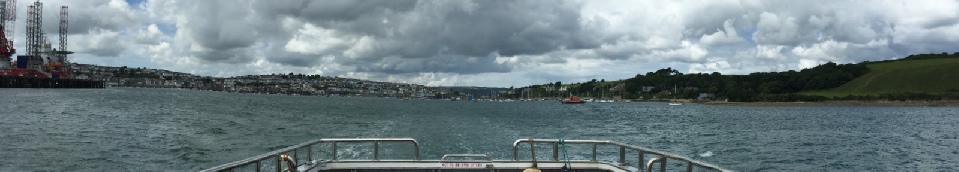
The aim of the Pontoon study on the morning of the 27th June was for Group 9 to create
a time series of multiple physical and bio-
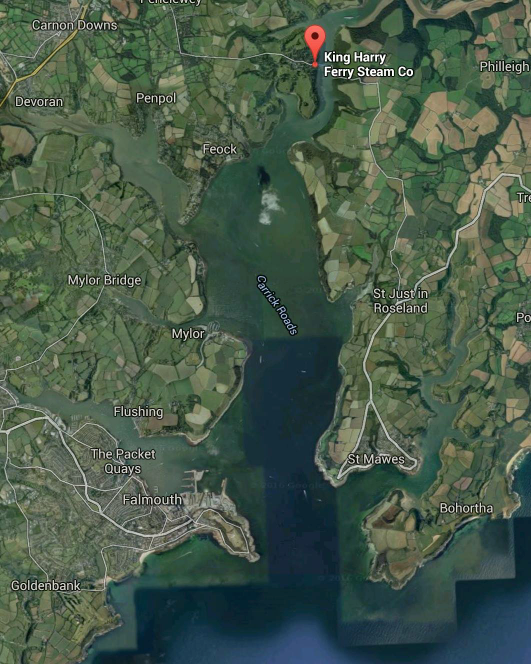
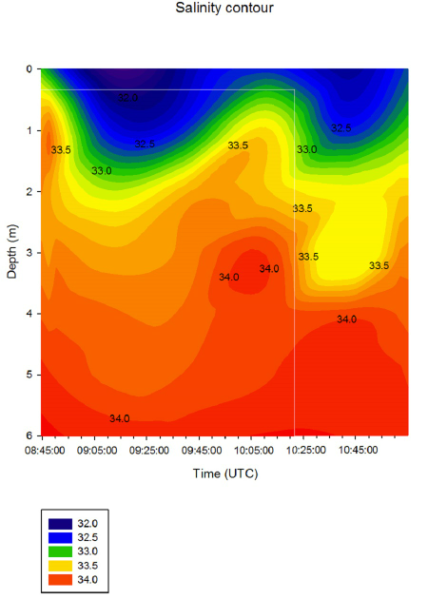
Fig 1.1 Change in salinity over time and depth
An increase in salinity was observed until a peak was reached at approximately 10:00 UTC (fig 1.1) which correlates to the high tide at 09:56 UTC. This increase in salinity was due to more saline water flowing upstream on the flood tide. The salinity then decreased after 10:00 UTC as more freshwater flowed downstream on the ebbing tide. The greatest change in salinity observed was in the surface waters going from 31.5 to 33.5 in 2m. The overall range goes from 31.5 at the surface waters and 34.5 at the bottom waters.
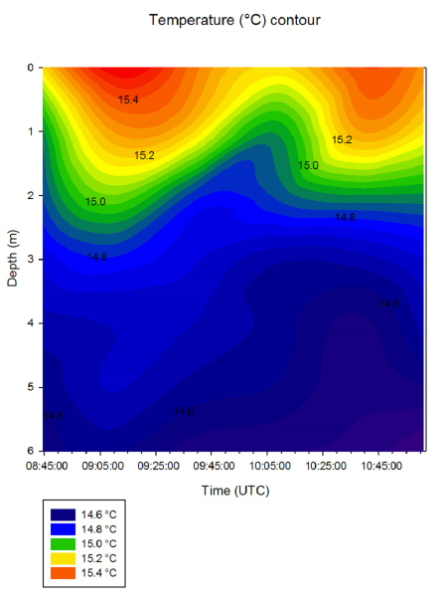
The surface water temperature (fig 1.2) was warmer than the deeper water (>2m) due to heating by solar radiation, which reaches the surface water and not the deeper water (fig 1.3) causing there to be almost 1°C difference from the top of the water column (15.5°C) to the bottom (14.5°C). This also results in a decreasing gradient of temperature from the surface downwards, much like salinity. The stratification of the water column is also causing the observed temperature differences (fig 1.2) because the colder denser seawater is under the warmer fresh river water. The temperature and salinity contour plots (fig 1.1 and 1.2) gradients indicate and estuary of high stratification with two distinct bodies of water with the fresh warmer and less saline water on top and the more saline and cooler seawater underneath.
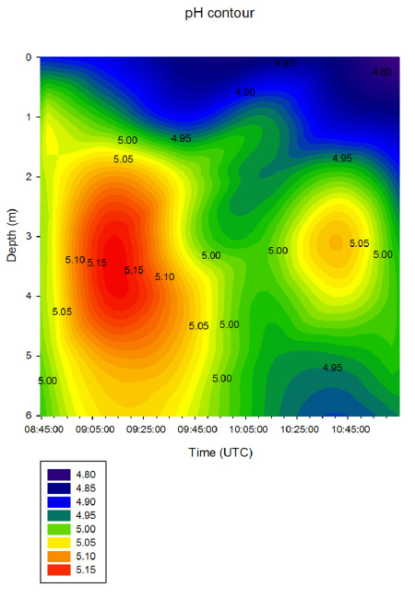
The surface water over the time series appeared to be more acidic and the deeper water (>2m) more alkali (fig 1.4). However, there was not a clear pattern of pH change, neither was there a significant change. The surface freshwater being more acidic could be due to it being from rainwater of an acidic source or dissolution of catchment rock resulting in a lower pH but is most likely attributed to dissolved carbon dioxide at the surface lowering the pH (Feely et al., 2010).
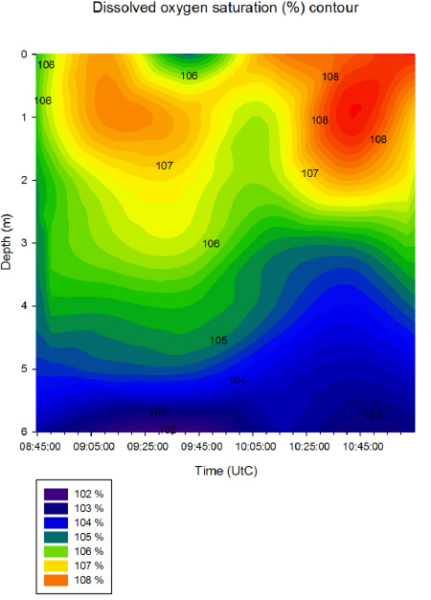
The upper part of the water column had the greater oxygen saturation (approximately 107%) when compared to the deeper part of the water column (approximately 104%) (Fig 1.5). This is a result of primary production being more concentrated to the upper part of the water column due to greater irradiance being far greater in the 2 metres below the surface. The whole water column from 08:45 UTC to 11:05 UTC was supersaturated with oxygen indicating photosynthesis is occurring.
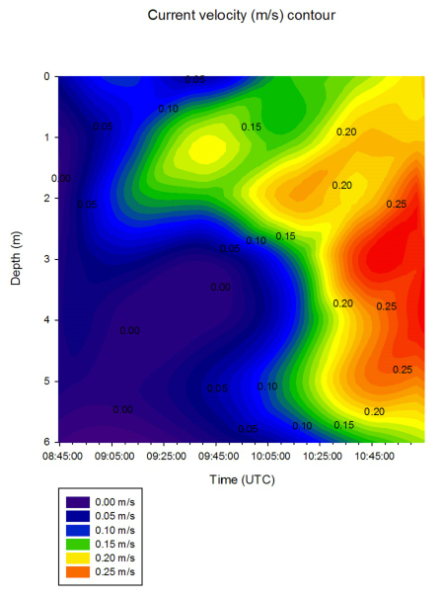
Flow velocity with direction over time and depth. Positive numbers indicate flow in a northerly direction in relation to the pontoon (towards the river endmember).Positive current velocity values were defined as north and negative current velocity values were defined as south (fig 1.6) because the King Harry pontoon’s north to south orientation. The surface waters appear to be more affected by wind and deeper waters appear to be more tidally affected. There is a clear change in direction and flow velocity around 10:10 UTC corresponding to the time of high water at 09:56 UTC and a change of flooding tide to ebbing tide. The ebbing tide reached velocities greater than 0.25 m/s, which was comparatively stronger than the flooding tide which only reached velocities of approximately 0.05 m/s. This is possibly because we started recording towards the end of the flood tide.
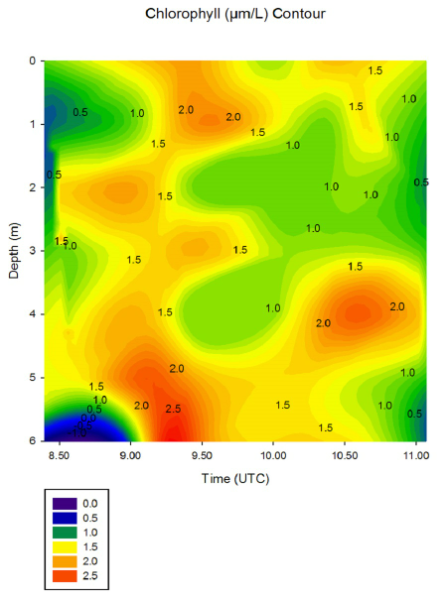
Chlorophyll is an approximation of phytoplankton and there appears to be no correlation of the position of phytoplankton in the water column to oxygen saturation or the tidal position. However, the phytoplankton appears to be in larger concentrations at the surface and at depth (fig 1.7). Being at the surface is beneficial to phytoplankton as this is where irradiance in the water column is highest (fig 1.3) and being at depth near the sediment is beneficial to phytoplankton because a resuspension of sediments is a source of nutrients to them (Corbett, 2010) and is often limiting at the surface. Chlorophyll concentration ranged from 2.7 µm/L to 0.3 µm/L with peaks spread out over the time series and at depth.
Click to expand
Click to expand
Click to expand
Click to expand
Click to expand
Click to expand
References:
Corbett, D. R. (2010). Resuspension and estuarine nutrient cycling: insights from the Neuse River Estuary, Biogeonsciences, 7(10); 3289–3300
Feely R. A. (2010). The combines effects of ocean acidification, mixing, and respiration
on pH and carbonate saturation in an urbanised estuary, Estuarine, Coastal and Shelf
Science, 88(3); 442-
The thermocline and halocline found through the analysis of our data provide a good indication that the water column of the Fal estuary sampled at the King Harry pontoon is a stratified one. The data and analysis of the current metre shows the change of direction of flow corresponding to the predicted high tide at 09:56 UTC and can provide a possible explanation to the other measured parameters. The King Harry Pontoon is one that is used often by a local ferry, a mooring point for small vessels and is often passed by potentially large vessels causing a wake. All of these points have the ability to affect our data by either directly by the wake or indirectly by the ferry or private moorings causing us to remove the measuring instruments from the water.
| Introduction |
| Methods |
| Results |
| Discussion |
| Introduction |
| Methods |
| Results |
| Physical |
| Chemical |
| Biological |
| Introduction |
| Methodology |
| Results |
| ADCP |
| Richardson |
| Physical |
| Chemical |
| Biological |
| Introduction |
| Methods |
| Poster |