
The views expressed on this website are not those of the University of Southampton or the National Oceanography Centre Southampton
King Harry’s Pontoon
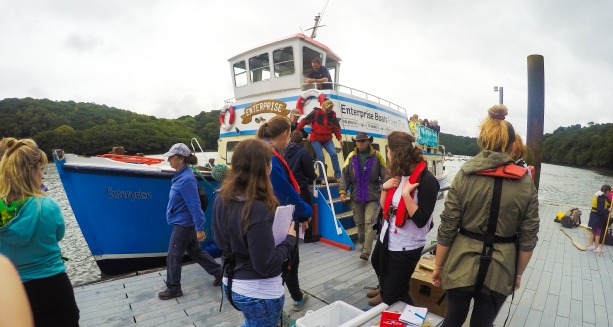
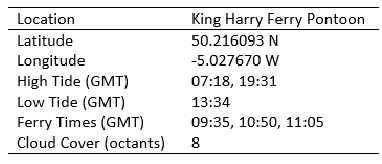
King Harry Ferry pontoon is situated on the Fal Estuary (50.216093 N, -5.027670 W), upstream from the Channals creek and downstream from the convergence of the Truro and Fal rivers. The pontoon is in-between the King Harry Ferry crossing, 40m upstream, and a mussel farm downstream. A time series for the morning of the 22nd of June 2016 was recorded to investigate tidal influences on the chemical physical, and biological composition of the river.
Methods
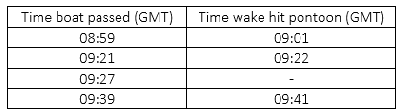
Profiles were taken every half hour from 08:51 GMT, barring interruption by the passenger ferry. Chlorophyll data was obtained by Niskin bottle samples taken every 1m from the surface, which were fixed with acetone before being foiled and stored in a freezer for 24 hours, to be later analysed using a 10 AU fluorometer. An EXO probe was used to observe changes in pH, temperature, salinity and dissolved oxygen every 1m from the surface. The salinity measurements from the EXO probe were calibrated using the CTD onboard the Bill Conway vessel as the EXO probe salinity readings were out by 12. A flow meter was used to measure flow velocity and direction, with readings being taken every 0.5m from the surface. Light Usable for Photosynthesis (LUP) was determined using a light sensor and readings were taken every 1m from the surface. Ambient light was also recorded. The depths of the instruments deployed were estimated by the length of the line and any drifting by the instruments was not accounted for. Figures and statistical analyses were carried out in Sigma Plot.
Results
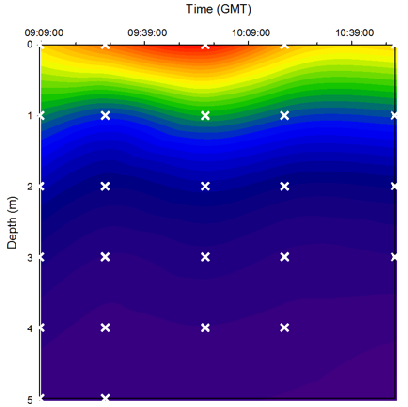
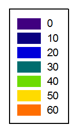
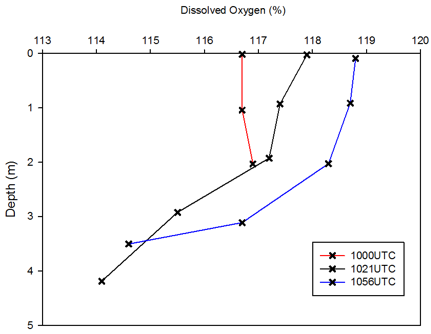
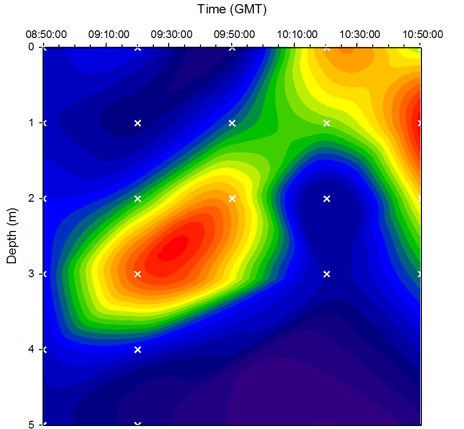
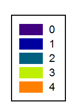
Figure 19. Light usable for photosynthesis (% LUP) taken at King Harry Ferry pontoon (50.216093N, 5.027670W) in the Fal Estuary water column. Measurements taken from 09:09 to 11:00 (GMT) on 22/06/16, with time and depth of measurement indicated by crosses. Depth was measured using length of line deployed.
Figure 20. Chlorophyll concentrations at King Harry Ferry pontoon (50.216093N, 5.027670W) in the Fal Estuary water column. Water samples taken from 08:50 to 11:00 (GMT) on 22/06/16 using a Niskin bottle and hydroline. Time and depth of each measurement is indicated by crosses. Depth was measured as length of line deployed.
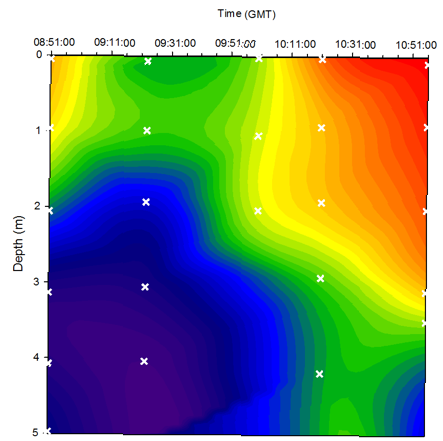
Figure 21. Temperature at King Harry Ferry pontoon (50.216093N, 5.027670W) in the Fal Estuary water column. Measurements taken from 08:50 to 11:00 (GMT) on 22/06/16 using an EXO probe. Time and depth of each measurement is indicated by crosses.
Figure 22. Salinity at King Harry Ferry pontoon (50.216093N, 5.027670W) in the Fal Estuary water column. Measurements taken from 08:50 to 11:00 (GMT) on 22/06/16 using an EXO probe. Time and depth of each measurement is indicated by crosses.
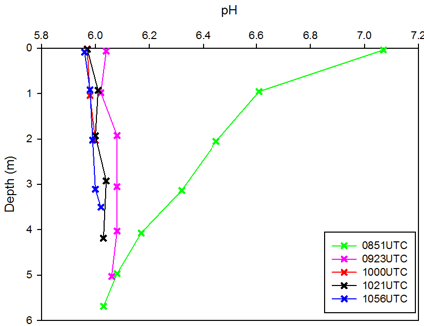
Figure 17. pH depth profiles taken at King Harry Ferry pontoon (50.216093N, 5.027670W) on the Fal Estuary. Measurements taken from 08:50 to 11:00 (GMT) on 22/06/16 using an EXO probe.
Figure 18. Dissolved oxygen % depth profiles at King Harry Ferry pontoon (50.216093N, 5.027670W) in the Fal Estuary water column. Measurements taken from 10:00 to 11:00 (GMT) on 22/06/16 using an EXO probe. The 10:00 profile was interrupted at 3m and could not be completed.
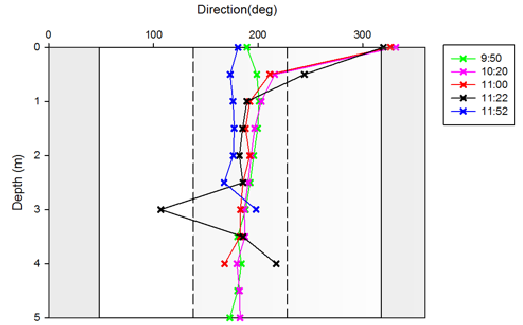
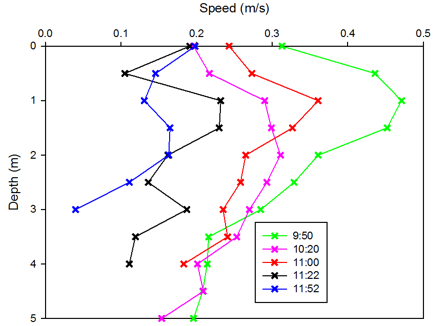
Figure 24. Flow direction depth profiles at King Harry Ferry pontoon (50.216093N, 5.027670W) in the Fal Estuary. Measurements taken from 08:50 to 11:00 (GMT) on 22/06/16. Downstream flows are those bounded by 138º and 228º as indicated by the dashed line, upstream flows are those bounded by 318º to 48º, as indicated by the shaded area. Depth was measured using length of line deployed.
Figure 23. Flow speed depth profiles at King Harry Ferry pontoon (50.216093N, 5.027670W) on the Fal Estuary. Measurements taken from 08:50 to 11:00 (GMT) on 22/06/16. Depth was measured using length of line deployed.
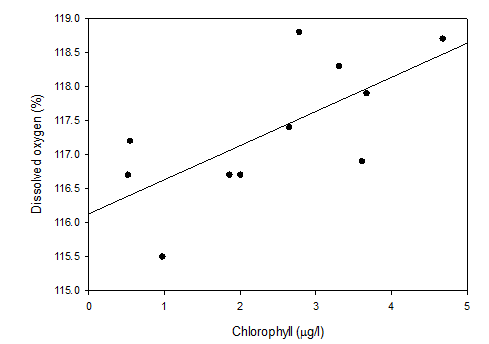
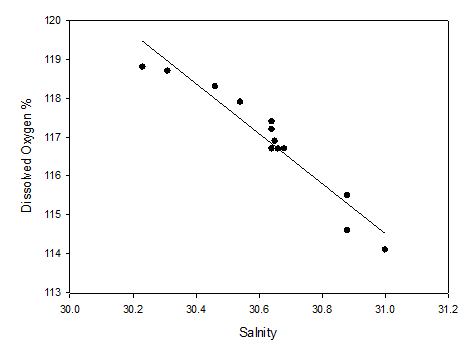
Figure 25. Chlorophyll (g/l) against Dissolved oxygen % at King Harry Ferry pontoon (50.216093N, 5.027670W) in the Fal Estuary water column. Measurements taken from 10:00 to 11:00 (GMT) on 22/06/16. (R2=0.47).
Figure 26. Dissolved oxygen % against Salinity at King Harry Ferry pontoon (50.216093N, 5.027670W) in the Fal Estuary water column. Measurements taken from 10:00 to 11:00 (GMT) on 22/06/16. (R2=0.92)
From 08:51 to 09:23 temperatures decreased, afterwards temperature increased with time and always reduced with depth. The maximum temperature 15.9⁰C, was recorded at 10:56 at the surface and a minimum of 15.1⁰C was recorded at 09:23 at 5m depth (Figure 21). Salinity followed a similar pattern. An initial increase in salinity was recorded from 08:51 to 09:23 after which, salinity decreased with time and always increased with depth (Figure 22). pH decreases with time, and increases slightly with depth for most profiles. Values remain around 6, with the exception of the first profile at 08:51 where the pH decreases with depth from 7.1 at the surface (Figure 17). Dissolved oxygen increases with time and decreases with depth with a maximum at 10:56 of 118.8% and minimum at 10:00 of 116.7%.
The light usable for photosynthesis (LUP%) reduced exponentially with depth with a peak of 68% recorded at 10:00 (Figure 19). Flow direction was mostly downstream (between 138-228⁰) except at 8:50, 10:20 and 11:00 at the surface where flow direction was approximately 330⁰ upstream. Maximum speeds occurred at 8:50 and lowest speeds occurred at 11:52. Speed increased from the surface to its maximum at 1m, after which it decreased with depth at times 8:50, 10:20 and 11:00. Speeds at 11:22 and 11:52 were variable but generally the speed also decreased with depth after 1m (Figure 23).
Between the surface and 1 m chlorophyll increased with time. A maximum of 4.2 µg/l was recorded at 9:20 at 3m (Figure 25). Chlorophyll and dissolved oxygen were positively correlated for the profiles available from the dissolved oxygen data (R2=0.47) (Figure 18). Each were then correlated against salinity for all profiles available. Dissolved oxygen was negatively correlated against salinity (R2=0.92), as salinity increased, dissolved oxygen decreased (Figure 26). Chlorophyll and salinity were scattered, with no apparent correlation.
Discussion
The results reflect the influence of the tide as it ebbs. As the seawater influence is reduced, a shift, from colder more saline water, to warmer fresher river water was seen.
Profiles taken with the EXO probe had some issues, particularly the first profile taken at 08:51. Temperature, salinity and pH do not fit the pattern expected of the ebbing tide that can be seen in subsequent measurements. The pH values were more acidic than expected. A pH of 7 would be more typical for this site which may indicate a calibration issue with pH sensor on the EXO probe.
The flow was generally consistent with what would be expected during the ebb tide, apart from some upstream flows recorded at the surface. This was possibly due to the nature of measuring flow off a structure like the pontoon, which juts out into the estuary, creating more turbulent flows. The pontoon may also reduce current speeds and break up waves, which will affect the data collected thus not reflecting the overall flow of the estuary [9]. Though wind measurements were not taken at the pontoon, personal observations indicate that wind strength was not strong enough to create a reverse flow.
Friction from the bed and the surface reduce flow speeds, however the influence of the boundaries decrease with distance. Since the friction at the bed is greater than that at the surface, the maximum speeds were seen at 1m, closer to the surface.
The peak in irradiance recorded at 10:00 is likely to be caused by changes in turbidity throughout sampling. Passing boats and their wakes could resuspend materials, increasing turbidity [10]. The light irradiance at 10:00 was recorded just before the passenger ferry arrived at 10:05 and interrupted sampling, whilst subsequent measurements were taken after the ferry had disturbed the water column. We could further test this theory by measuring light irradiance both before and after the arrival of a passenger ferry and monitor the effects on the water column.
The increase in chlorophyll with time, as the tides ebbs, is due to higher river water inputs of nutrients seen at site C3 from the estuarine data (Fig. 9, 10, 11). High chlorophyll values at depth could be due to resuspension at the bottom. The dissolved oxygen concentrations are supersaturated; the presence of and correlation with chlorophyll is indicative of photosynthesis taking place. Increases in chlorophyll with time, increased the dissolved oxygen [11]. As the tide ebbs and oxygenated river water influences the composition of the water column more, dissolved oxygen levels increase (Fig 26) [12].