
The data was taken on the King Harry’s Ferry Pontoon, located in the Falmouth Estuary close to a shellfish farm.The pontoon is used for a ferry and is open for leisurely use by the public, which at times would have affected some of our data.
YSI Multi-
The YSI Multi-
Valeport Current Meter
The current meter recorded the speed (ms-
Due to the pontoon being open to leisure craft for mooring and the premature arrival of the Conway flow measurements were taken occasionally from different points on the pontoon in an effort to reduce the impact of the boat presence on the current data.
Chlorophyll
Two 50ml samples were taken from the surface water which were subsequently filtered
using glass-
Light Meter
Two sensors were deployed one remained on the pontoon the other was placed into the water taking readings of light intensity at 1m intervals from the surface. The sensor that remained on the pontoon recorded the ambient fluctuation in light in intensity due to influences such as cloud cover, these readings allow for the correction of the data obtained from the submerged probe.
Temperature
Defined thermocline present between 1-
Minimum Temperature: 15.00 °C -
Salinity
Contour plot reveals that lower salinities are located at the top of the water column (which coincide with higher temperatures) with an increase in salinity with depth. The contour shape of the halocline approximately follows that of the thermocline again providing support of two distinct water species. The estuarine salinity increases with the approaching high tide indicating the movement of seawater further up the estuary with the tidal movement (increase from 32.01 to 34.60 PSU).
Minimum Salinity: 32.01 PSU -
pH
Vertical gradient of pH with the highest values being located at the top of the water column and the lowest at the estuarine bed, depth of intermediate values reflects the boundaries of the halocline.
Minimum pH: 8.13 -
Dissolved Oxygen-
In a similar fashion to pH dissolved oxygen is vertically separated with the highest values located at the top of the water column and the lowest at the estuarine bed this is due to the reduced atmospheric interaction at depth. Two distinct peaks occurred at ~1m depth, one at 09:30:00 and the other at 10:30:00.
Minimum Dissolved Oxygen: 113.3 % -
Chlorophyll Concentration (YSI Multi Probe)
No clear vertical separation, two distinct peaks located at ~1m depth (08:30:00) and ~4m depth (10:30:00).
Minimum Chlorophyll Concentration: 2.81 µg/L -
Chlorophyll Concentration (Surface Samples) -
No significant increase across the 3 hour sample period, however there is a fluctuation of ~ 0.1µg/L from each instance of measurement.
Minimum Chlorophyll Concentration: 0.002 µg/L -
Current speed -
The highest values of flow are located at median depths between 2-
Minimum Current Speed: 0.000 ms-
Light Intensity -
Exhibits a fairly uniform decrease with depth, two peaks were recorded in the surface water at 09:00:00 and 11:00:00.
Minimum Light Intensity: 0.54 % -
Turbidity -
Between the times of 08:30:00 and 10:00:00 the greatest turbidity is located at the
estuarine bed ~4.5-
The estuary salinity increases with time and approaching high tide (11:05), indicating the movement of seawater into the estuary. Lower salinity values at the surface shows a stratified estuary. Temperature and salinity present opposite behaviour, with higher temperatures in surface coinciding with lower salinity values. The shape of thermocline follows the salinity structure of the water column suggesting the presence of two distinct water species at the pontoon flowing over one another. Temperatures decreases with depth during the entire sample period.
The top of the water column presents the highest values of pH and dissolved oxygen due to atmospheric interaction, dissolving CO2 and O2. pH and dissolved oxygen decrease with depth as atmospheric interaction decreases. Two distinct peaks occurred at around 1m depth, one at 09:30 and the other at 10:30. This can be caused by wind and current changes.
Chlorophyll concentration do not show vertical separation, but present two distinct peaks around 1m depth (08:30) and around 4m depth (10:30). This can be explained by current speed and direction.
Current speed presents higher values between 2 and 4 meters, with lower values at the bottom and at the surface. At around 11:00 the flow at median depth significantly declines and then resumes at 11:30, a phenomenon possibly linked to the influence of the tidal cycle (high tide at 11:05) which induced a period of slack water.
Light intensity decreases with depth, presenting two peaks in surface at 09:00 and 11:00.
Turbidity presents higher values in estuarine bottom from 08:30 to 10:00. Around the high tide period (11:05), a second peak stands out around 3 meters deep. This could be caused by a decrease in current speed (around high tide). At middle depths (from 1 to 3 meters), turbidity decreases with increasing time until 11:00, while current speed presents high values.
Date: 25.06.2015
Time: 8:30 (UTC)
Location: King Harry’s Ferry Pontoon
50° 12'57 N
005°1'39 W
High tide: 11:05 4.1m
Low tide: 17:35 1.8m
Cloud cover: 3/8
Sea state: 2/10
Disclaimer-
Falmouth 2015 Group

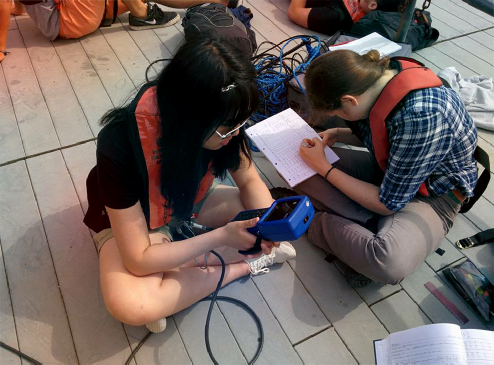
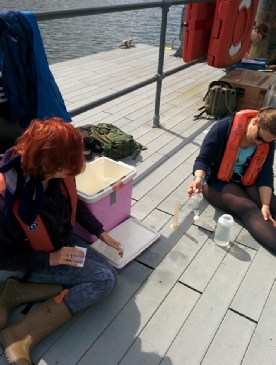
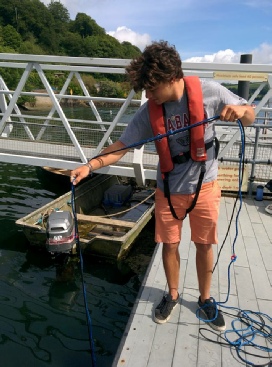
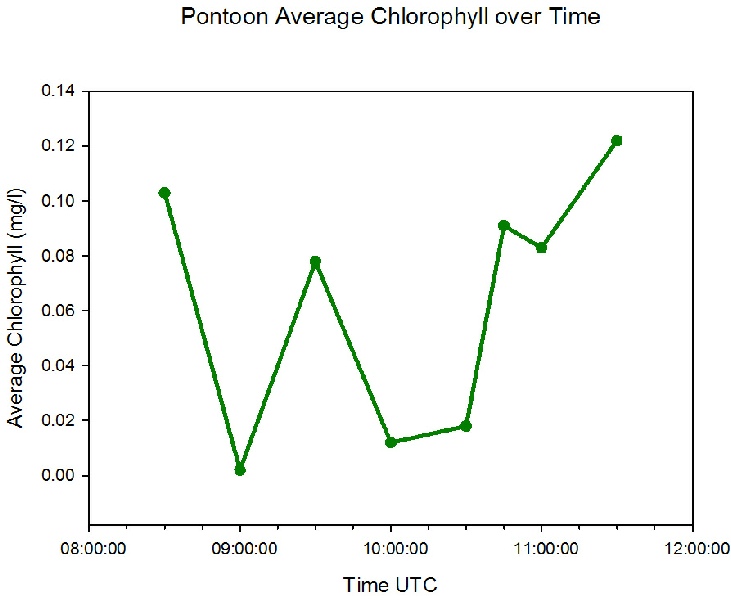
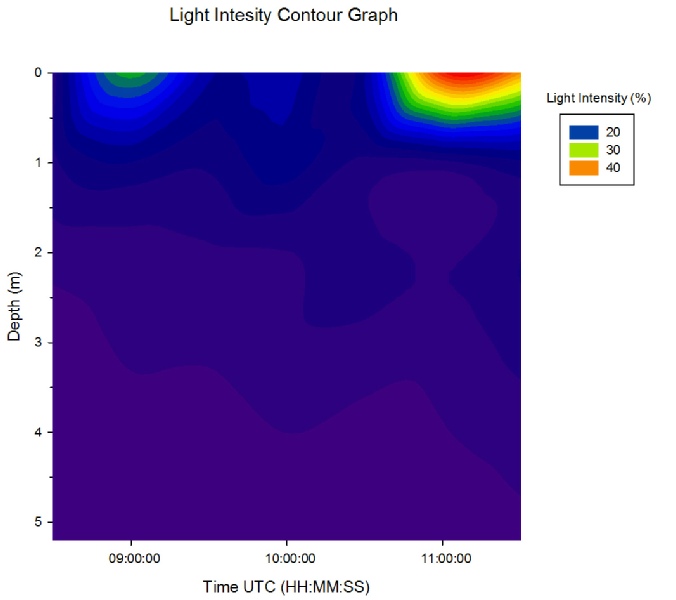
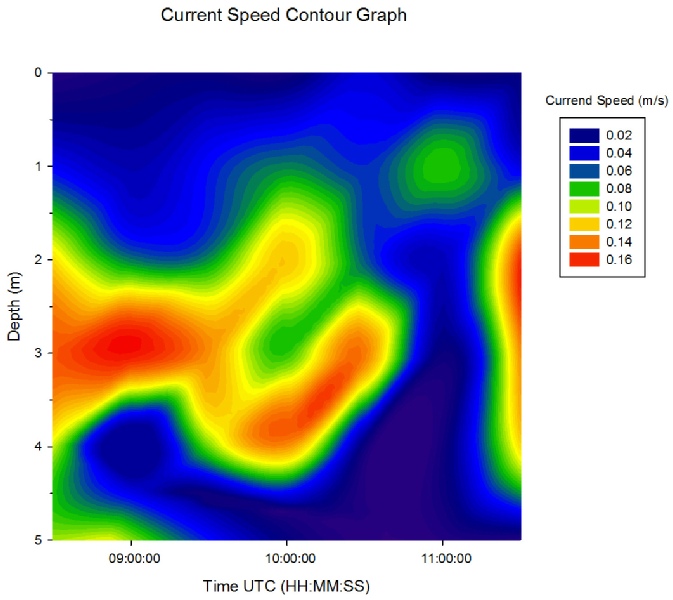
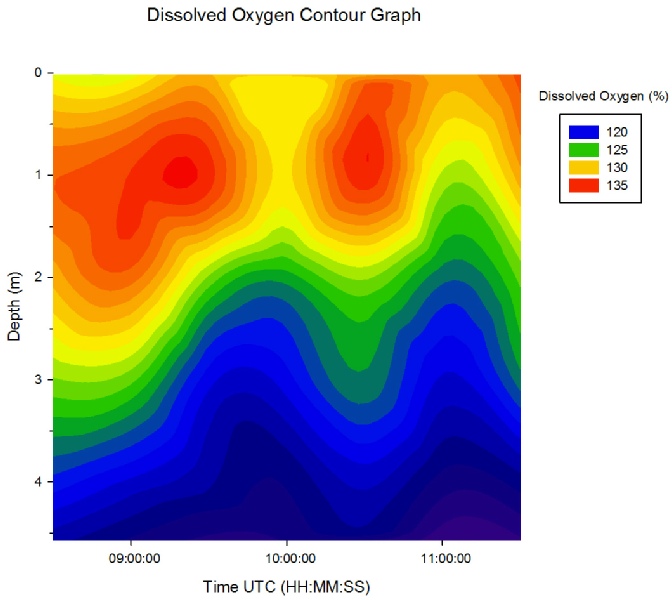
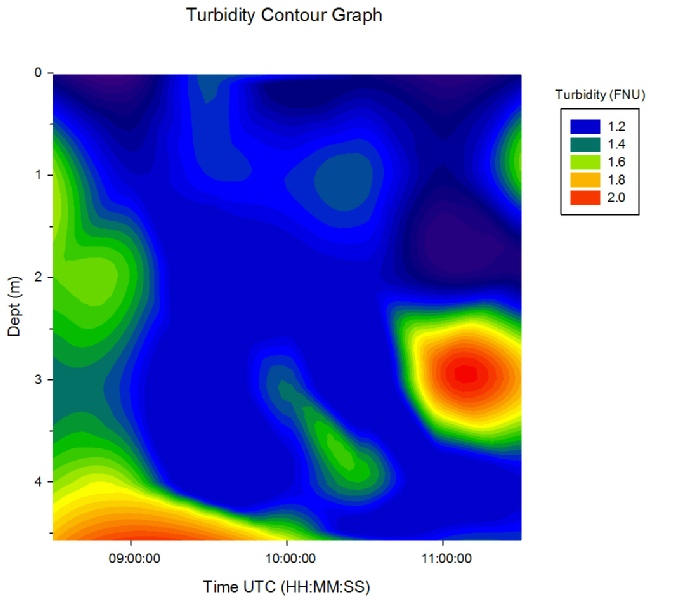
Figure 1. Dissolved Oxygen Contour Graph
Figure 2. Chlorophyll over time
Figure 3. Current speed contour graph
Figure 4. Light intensity contour graph
Figure 5. Turbidity Contour graph
| Aims |
| Methods |
| Results and Discussion |
| References |
| Benthic Habitat Map |
| Cameras |
| Aims |
| Methods |
| Results |
| Discussion |
| Aims |
| Methods |
| Results |
| Discussion |
| References |
| Aims |
| Methods |
| Results and Discussion |
| References |
| Temperature and Density |
| Nutrients and Oxygen |
| Chlorophyll and Fluorescence |
| Plankton |
| ADCP |