Metadata YSI Probe Current meter Chlorophyll
On the morning of 02/07/14 a time series survey was conducted of Fal estuarine water
from the King Harry pontoon. Between 09:30 and 12:30, half-
The first measurement was taken half an hour after high water. The overall salinity
was around 34 indicating strong seawater influence, however over the half-
The temperature at all depths increased throughout the morning and the surface saw a change from 17.85 to 18.4°C. This is likely due to warming by the sun and decreasing depth allowing for greater heat transit through the water column.
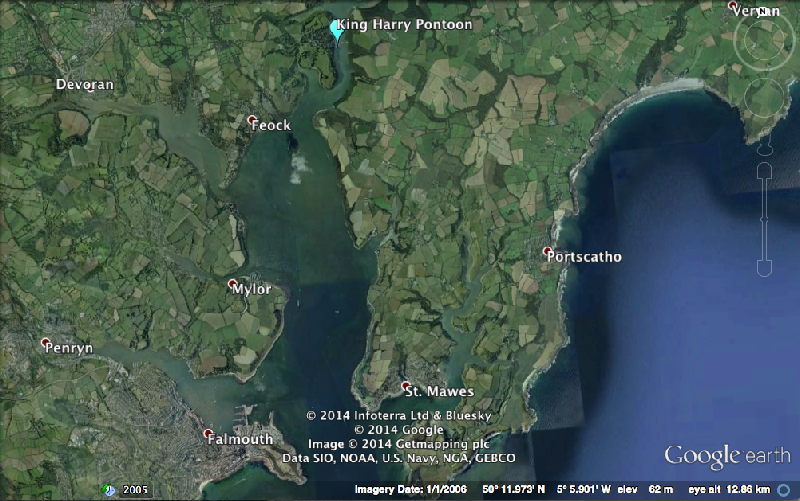
Figure 1.0
Google Earth image of King Harry pontoon, sampled on 2/7/2014.
2/07/14
0830 – 1130 UTC
50° 12'57N 005°1'39W
Sunny, calm weather with only 1/8 octaves cloud cover.
0909 UTC
1507 UTC
Overall the salinity range was small with the highest value being 34.75 at -
Temperature decreases with depth due to denser, cold waters sitting below the less dense surface water. Surface water heating throughout the morning lead to an increase in surface temperature with time, from 17.85°C at H.W. to 18.40°C . Temperature at depth also increased with time, possibly due to heat advection from the warmer surface waters.
Figure 2.1
Salinity with depth (m) time series, recorded at 30 minute intervals.
Figure 2.2
Temperature (°C) with depth (m) time series, recorded at 30 minute intervals.
Figure 3.1
Water velocity (m/s) with depth (m) time series, recorded at 30 minute intervals.
The water velocities measured at the pontoon over half a tidal cycle presented no significant velocity changes other than at H.W. At this time, water velocity presented its highest values across the cycle at 0.95m/s and 1.55m/s at the surface and at 1m depth. However, this variation likely is not natural, as a close passing ferry at this time may have affected the water velocity of the area.
Figure 2.3
Oxygen concentration (mg/L) with depth (m) time series, recorded at 30 minute intervals.
Over the course of the tidal cycle there was an overall increase in the oxygen concentration
away from high water, increasing to a maximum concentration of 9.69mg/l at -
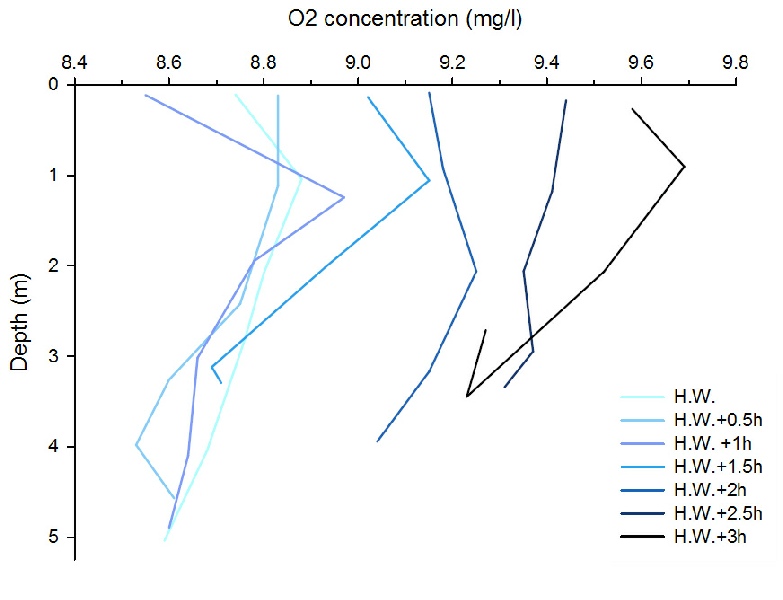
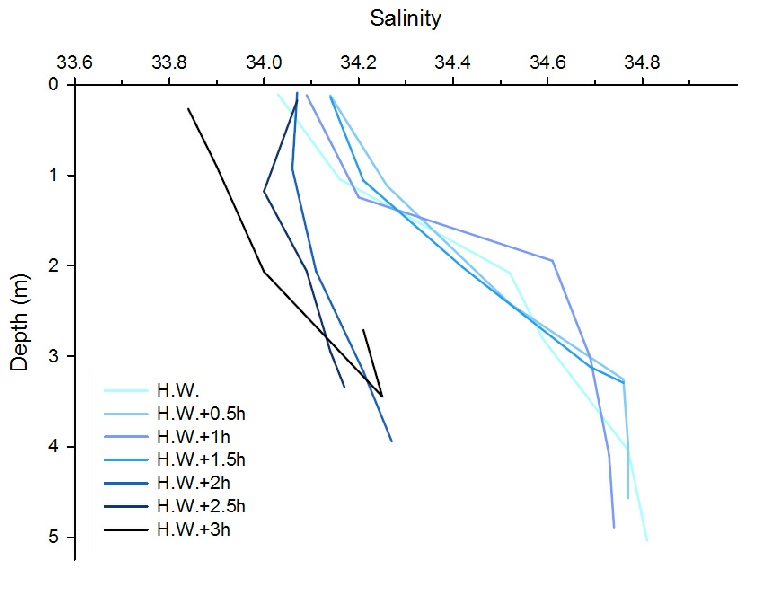
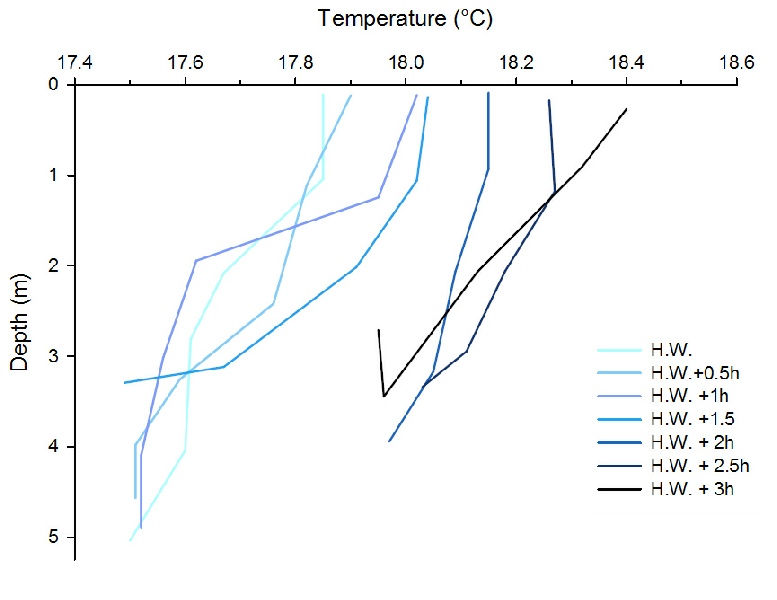
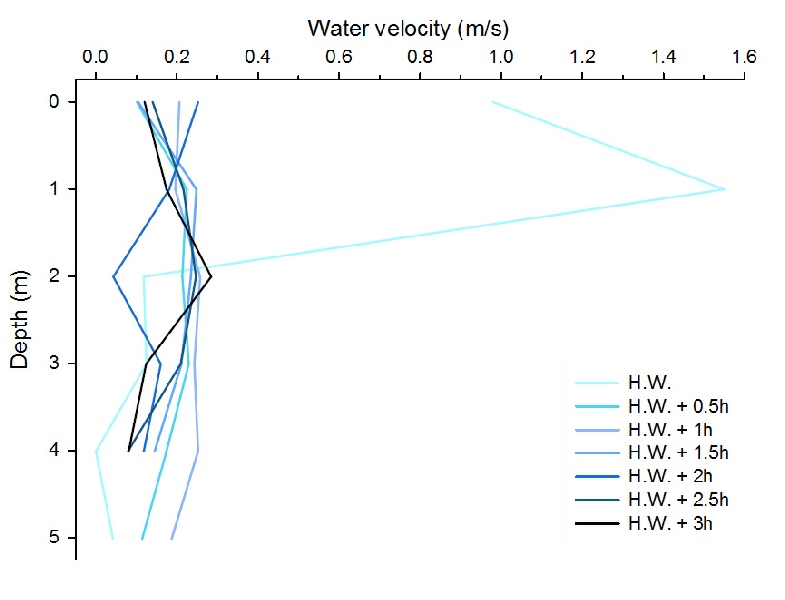
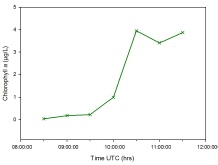
Figure 4.1
Chlorophyll Acetone derived samples taken at the surface of the water column at 30 minute intervals. The results displayed are averaged from the 2 samples taken simultaneously at the site.
Initial surface levels of chlorophyll was very low (<0.5µg/L), as the tide ebbed the concentration rose significantly (>4 µg/L). This is most likely due to an influx of algal material from further upstream.