Metadata Physical Chemical Biological
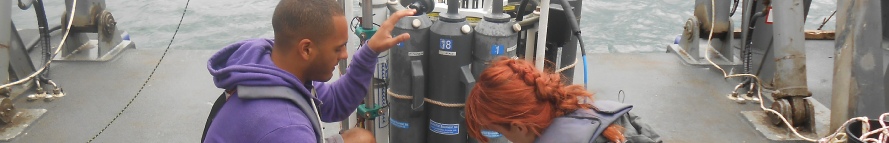
Following adverse offshore conditions, these data represent a time series survey in the Fal estuary over the course of half tidal cycle, beginning at 1006 UTC at low water and ending at 1613 UTC at high water. Physical measurements, including temperature, salinity, current data and turbidity, were taken hourly using a CTD rosette system with affixed fluorometer and transmissometer. Simultaneously, bottle and net samples were collected which were later analysed for plankton and nutrient levels in the lab. Further details of the survey can be found in the metadata below.
While the CTD data only showed limited variation, it was consistent with expected
changes over the tidal cycle. Slight stratification was observed at mid tide when
maximum current is predicted. This is due to the increased velocity of dense more
saline sea water entering the estuary, which then in turn causes slight stratification1.
The ADCP data supports this and shows a clear continuum in current speed over the
tidal cycle, peaking at 0.523ms-
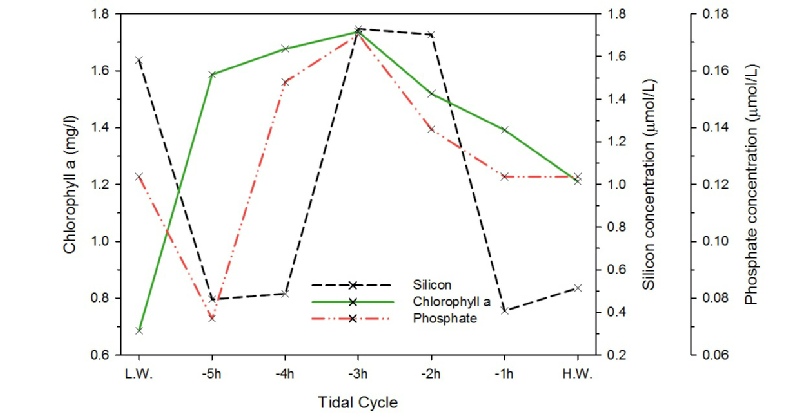
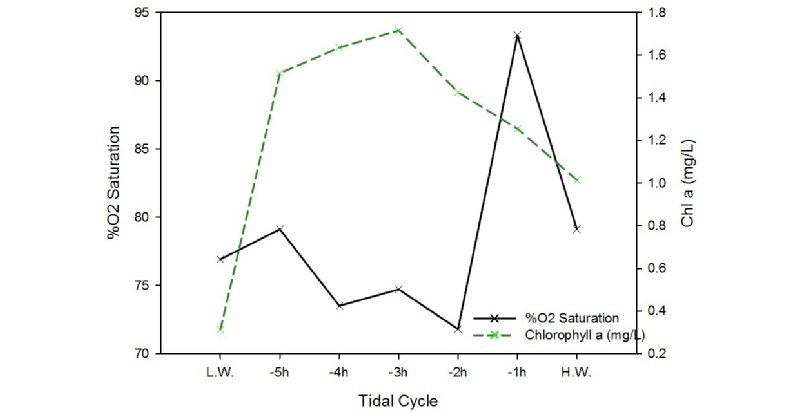
Bottle samples were analysed for dissolved oxygen, phosphate, nitrate, silicon and chlorophyll. The dissolved oxygen was relatively low over the tidal cycle, peaking 1 hour before high water at 93.4% which coincides with the drop in Chlorophyll concentrations. However with the lack of replication this result could be erroneous. The chlorophyll levels also peak at 3 hours before high water alongside the maximum nutrient concentrations; silicon and phosphate peak at 1.7µmol/L and 0.17 µmol/L respectively. Nitrate concentrations were below detection levels. This leads to the conclusions to be drawn as expected chlorophyll concentrations peaking would be expected to coincide with that of the maximum nutrient levels. However, the range in these values is so small that this variation could be negligible.
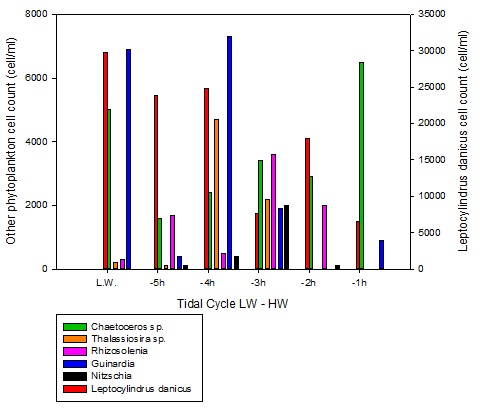
Phytoplankton samples from the Niskin bottles at all tidal states do not show any
significant trend. The species were dominated by Leptocylindrus danicus, showing
abundance of 300 000 cells/ml. Dominance of this species has previously been observed
in the lower coastal area of the estuary, also on the flooding tide2. The second
most dominant species was Guinardia sp. with 6900 cells/ml. The results suggest that
zooplankton abundance was highest at high water (HW) with 87 individuals/1m3, dropping
in abundance only slightly at mid-
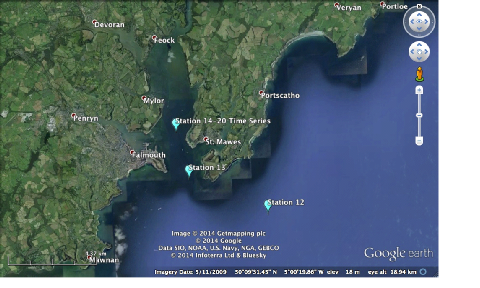
Figure 1.0
Google Earth image of sampling station positions on 25/06/2014 for both initial offshore
stations (Station 12 & 13), and time series (Stations 14 -
Date:
Location:
Weather:
Water depth:
Average wind speed:
Average wind direction:
High Tide:
Low Tide:
25/06/14
Station 12 -
Station 13 -
Station 14-
Cloud cover decreasing from 6/8 to
2/8 throughout the day.
No rain and calm water.
30m
11.4 knots
126.9°
1017 UTC
1557 UTC
Overall, dissolved silicon, phosphate and chlorophyll concentrations at the tidal time series station were low. Nutrient concentrations peaked at 3 hours after L.W. (1.75µg/L of chlorophyll, 1.75μmol/L of silicon and 0.17μmol/L of phosphate), which coincided with mid water, which is the period with the fastest tidal velocity leading to increased mixing at the surface of the water column. There appears to be a small relationship between biological activity and nutrients, however most variables appear to be most affected by the tidal state.
Figure 3.1
Silicon (µmol/L), phosphate (µmol/L) and chlorophyll (µg/L) time series from low to high water recorded at hourly intervals.
The oxygen concentration remains relatively constant (between 70% and 80%) across
the tidal cycle, except for a possible erroneous result at -
Figure 3.2
Dissolved oxygen (%Sat) and chlorophyll (mg/L) time series from low to high water recorded at hourly intervals.
The phytoplankton collected over the tidal time series did not yield any obvious patterns. Some of the species sampled show a possible decreasing trend with the incoming tide e.g Guinardia. However this trend is not followed by the other sampled species. There is clear species dominance by Leptocylindrus danicus which could be due to unseen biological processes. The species known for being dominant in the lower estuary2 . A change in phytoplankton abundance across the tidal cycle was not expected due to the chosen sampling strategy and constant location. Both sampling and analysis methods used have a relatively high margin for error, which may also affect the reliability for the data collected.
The zooplankton samples collected across the tidal time series show variation. The
lower tidal collections showed lowest species diversity with only 4 species and total
numbers of individuals of 25, with the highest diversity being mid tide with a total
of 7 different species and 75 individuals. However the highest individual numbers
are recorded at high water, 87 with 6 species. This mid tide increase could be due
to elevated phytoplankton concentrations observed at mid tide, coinciding with maximum
water movement and tidal flow causing stratification1. No obvious species dominance
is shown, however copepods are present across all sampling stations. They are largely
dominant in the 2 later stations occupying 20.2% of the total population. Overall,
however, zooplankton would not be expected to change drastically over a tidal cycle
at the same point. The sampling method used did not lend itself to accuracy, due
to the differing depths sampled (0-
Zooplankton
Figure 4.1
Phytoplankton (cells/mL) time series from low to high water recorded at hourly intervals.
The overall change in salinity was low and ranged between 34.95 and 35.15. This was
due to our location at the mouth of the estuary where seawater was dominant and freshwater
had little influence. From low water (L.W.) To high water (H.W.), the salinity generally
increased as seawater replaced the slightly fresher water from the estuary; this
was particularly evident towards the surface where the fresher water was concentrated
due to lower density. The highest level of stratification was seen at H.W.-
The total change in temperature with time did not exceed 0.4°C at any given depth, but did show a general pattern of warming. This may be due to seawater being slightly warmer than estuarine water due to downward mixing of the warm surface layer.
Figure 2.1
Salinity with depth (m) time series from low to high water recorded at hourly intervals.
Figure 2.2
Temperature (°C) with depth (m) time series from low to high water recorded at hourly intervals.
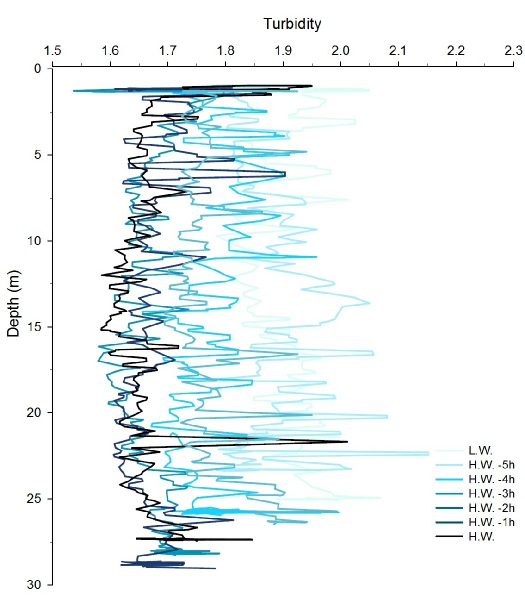
From L.W. to H.W., the turbidity decreased from an average of 2 to an average of 1.65. This corresponds to the relatively turbid river component of the water being diluted by the landward progression of seawater. The rate of decrease in turbidity increases between 1 to 3 hours after L.W. when current velocity is highest. The higher turbidity level at depth reflects increased (suspended particulate matter) SPM in bottom water from resuspended sediments from the seabed.
Fluorescence (v) of the water column has been calibrated to represent chlorophyll
(µg/L). Chlorophyll concentrations at L.W., and an hour after L.W. are highest in
surface waters and peaks at 1.8 µg/l at 4m depth. This chlorophyll maxima deepened
as the tidal cycle progressed towards H.W., to a depth of 7-
The deepening of the chlorophyll peak could also be attributed to an increasing irradiance at the water surface as the cloud cover decreased throughout the day.
Figure 2.3
Turbidity with depth (m) time series from low to high water recorded at hourly intervals.
Figure 2.4
Chlorophyll concentration (µg/L) with depth (m) time series from low to high water recorded at hourly intervals.
Figure 3.1
ADCP data profile over the tidal cycle taken at Station 14-
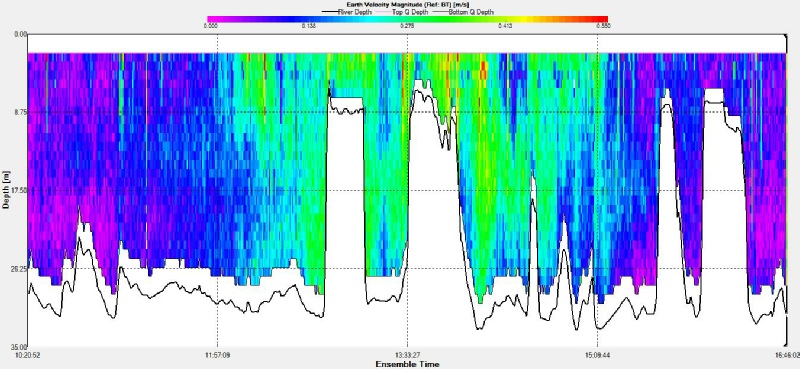
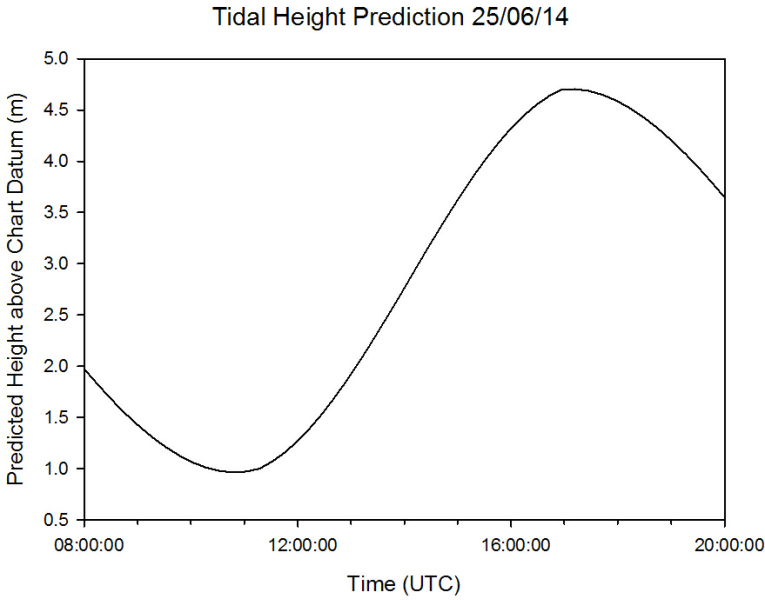
ADCP data taken over the time series shows how the water currents change with the
tidal cycle. On 25/06/2014 low water (LW) was predicted to occur 1017 UTC and high
water (HW) at 1557 UTC. The period of fastest water velocity was recorded from the
ADCP at approximately 1300 UTC, which can be described as medium water with speeds
of 0.523ms-
Across the stations, turbulent flow (low Richardson’s numbers) are observed across all depths, showing no significant pattern either with increased time or depth. The exception to this was Stations 17 and 20. At both of these stations, turbulent flow is recorded at the surface and at depth. This can be assumed to be due to wind and sea bed friction3. Laminar flow was observed at 15m at Station 17
and 15.5m at Station 20, and appears to coincide with thermo and haloclines are at their strongest. However, the validity of this pattern is questionable as temperature and salinity vary only discreetly, the thermo and haloclines are insignificant. The general turbulent flow observed across all stations is caused by the shallowness of the sampling area, here only 30m. Because of this shallow water, turbulence caused by friction with the sea bed affects the whole water column, therefore producing low Richardson’s numbers and turbulent flow4.
Figure 3.2
Figure 3.3
Figure 3.5
Figure 3.6
Figure 3.7
Figure 3.4
Depth profiles for Richardson’s number, temperature (°C) and salinity at Station
15 -
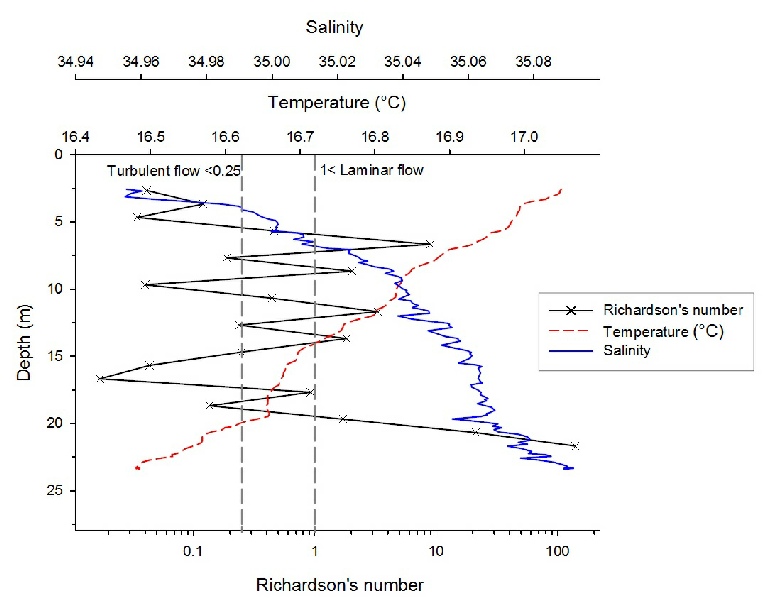
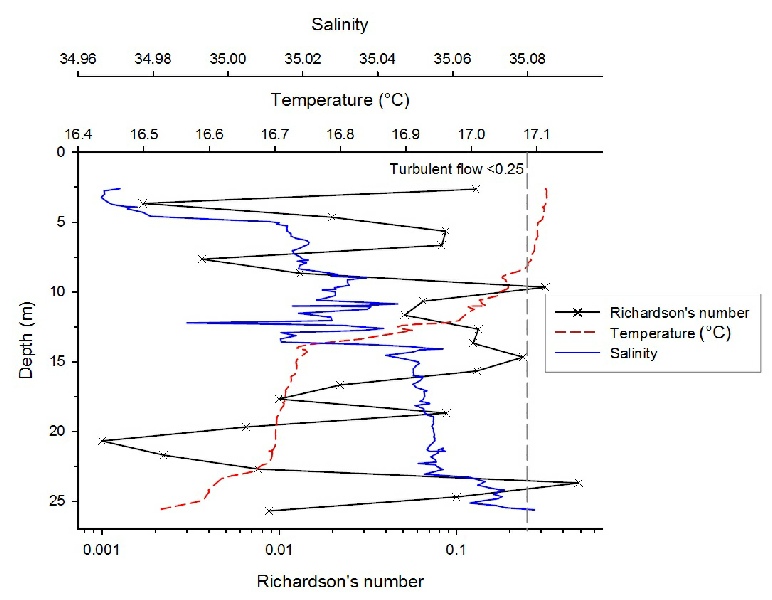
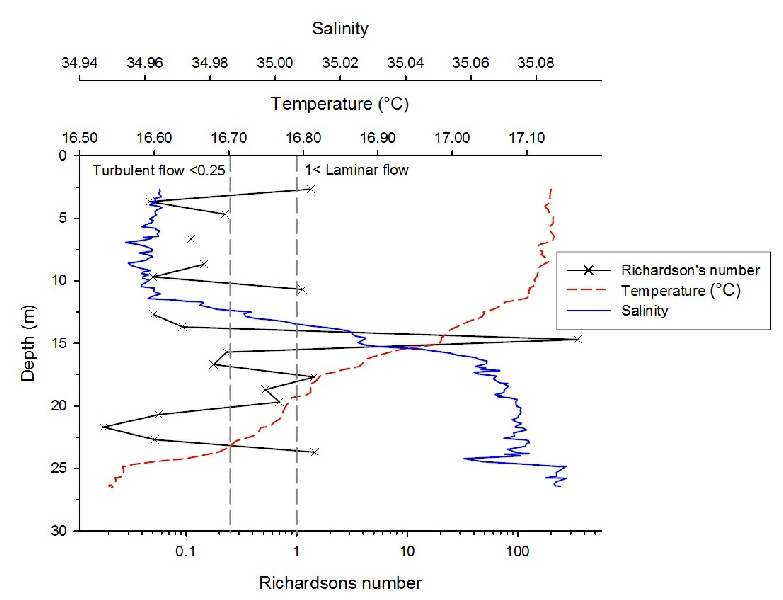
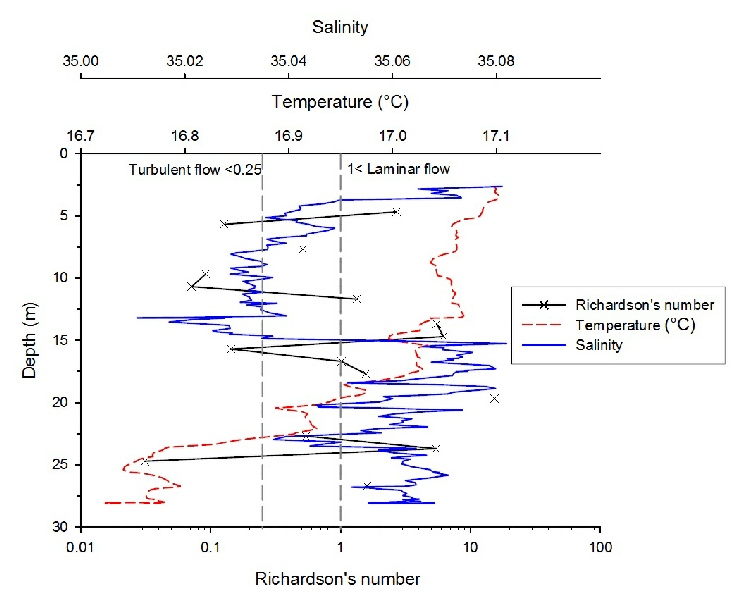
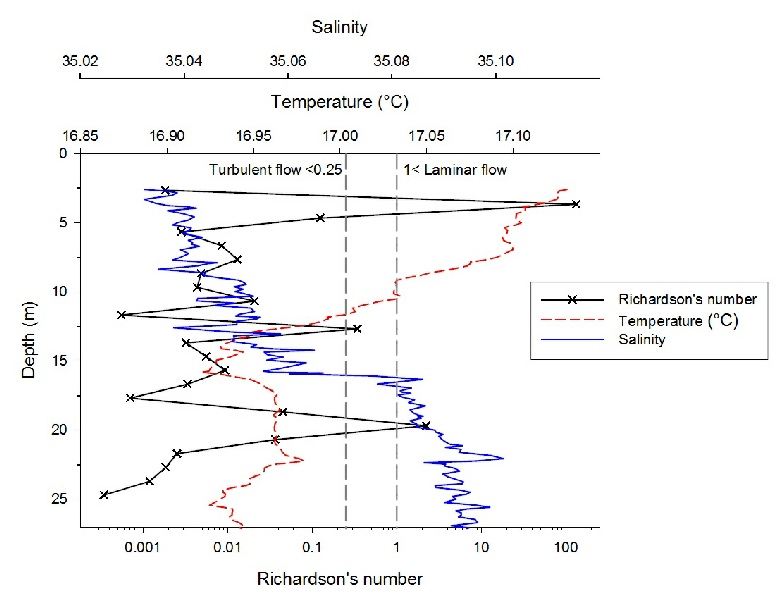
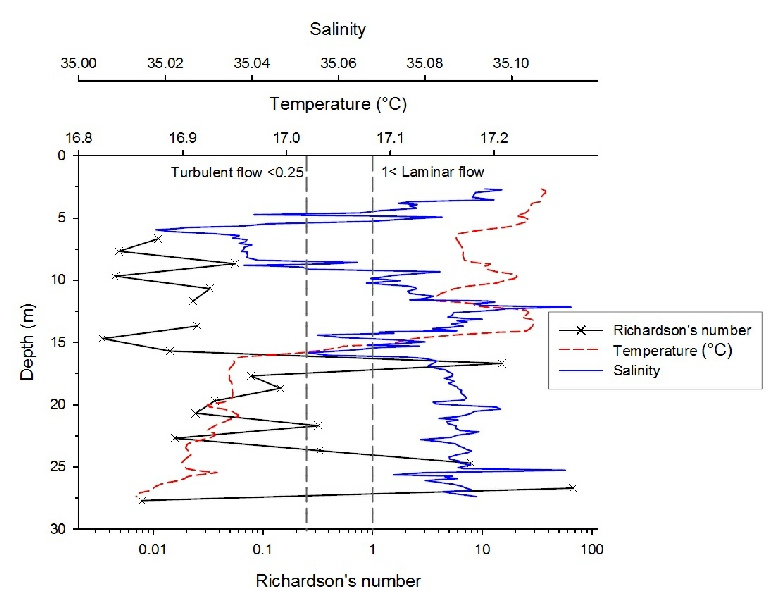

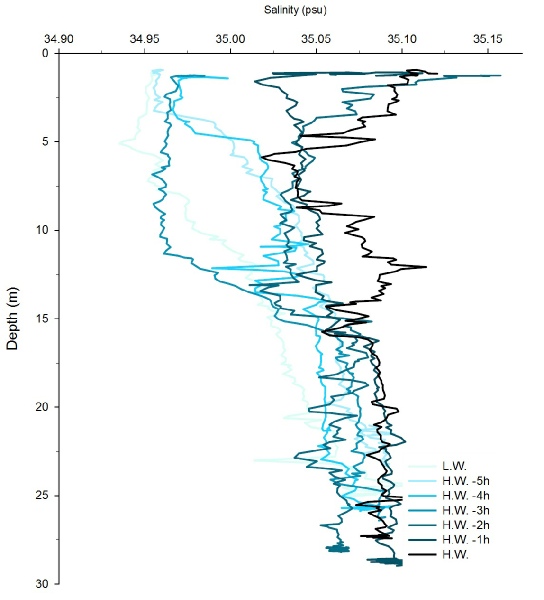
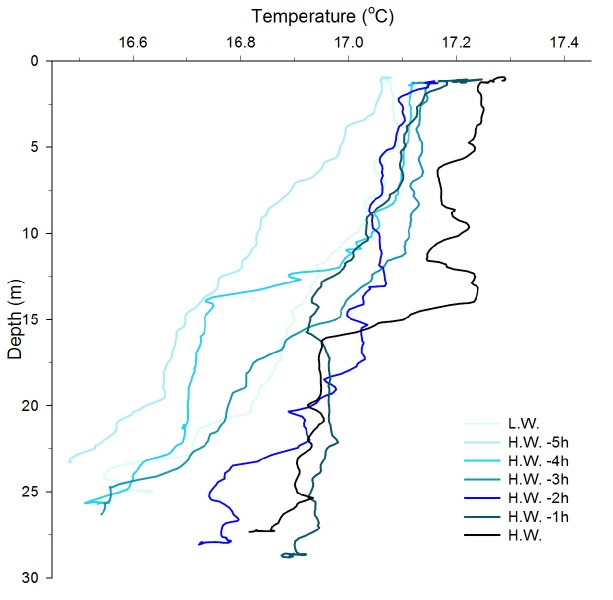
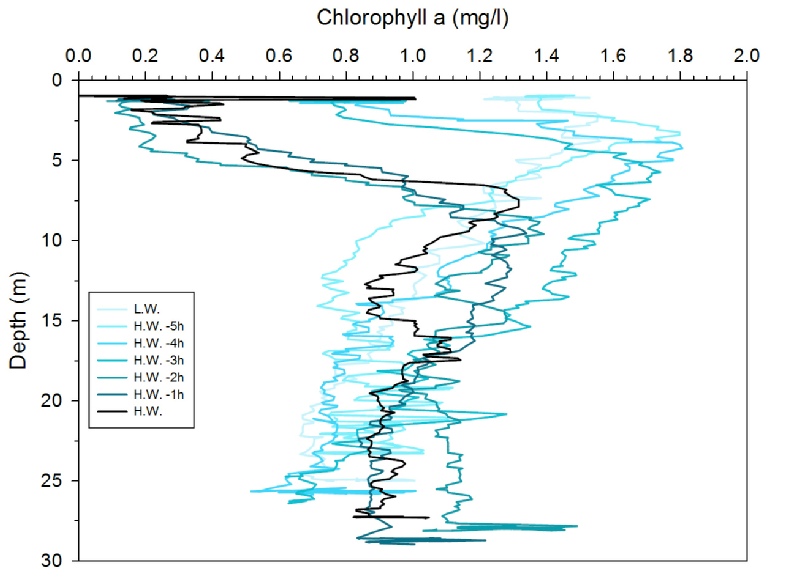
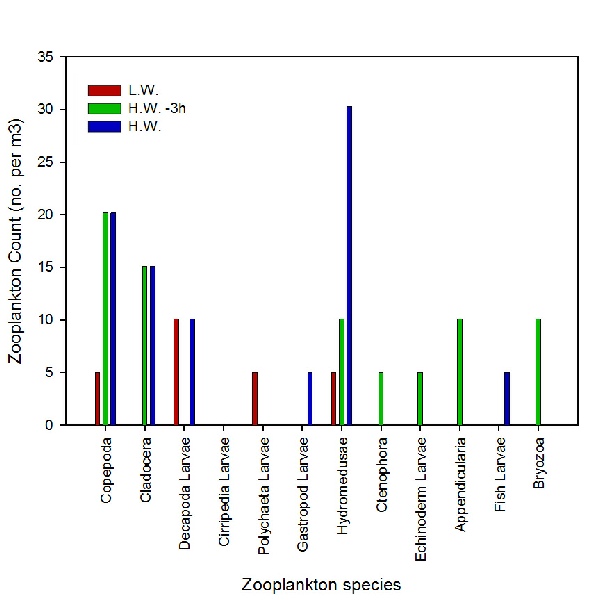
Figure 4.1
Zooplankton (cells/L) at low, mid and high water.