Metadata Physical Chemical Biological
On 03/07/14 a survey of the Fal estuary was conducted to investigate physical, chemical and biological properties of the water. The survey began at Station 1, at the mouth of the estuary, and proceeded with 7 more stations at points progressively further up the estuary.
At each station, a CTD profile was taken using a rosette sampler fitted with a multiprobe and Niskin bottles to simultaneously collect bottle samples. The CTD profiles show the temperature, salinity and fluorescence of the water while plankton amounts, nutrient levels, chlorophyll and dissolved oxygen were analysed from bottle samples. Further, at each station, the current across a transect perpendicular to the flow of the estuary was also investigated using an ADCP .
The water reached high tide at 0835 UTC, near the beginning of the survey and ebbed as the survey moved upstream. This provided an exaggerated change in water properties with location than if the stations had all been surveyed simultaneously.
03/07/14
Dry, calm weather.
0935 UTC
1615 UTC
The vertical profile of Station 4 took place at Feock the bottle-
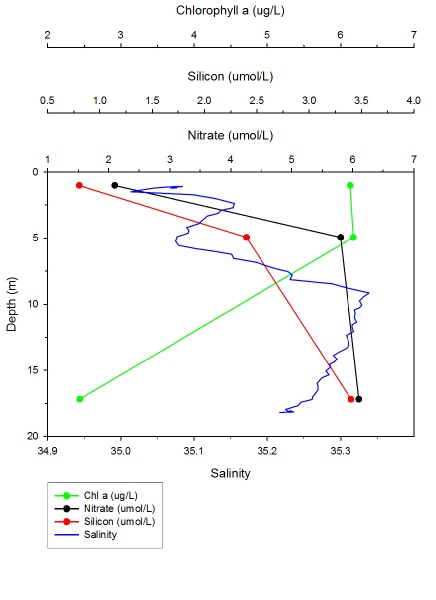
Figure 3.1
Silicon (µmol/L), phosphate (µmol/L), nitrate (µmol/L), and fluorometry (V) concentrations at Station 4 in the Fal estuary.
Dissolved Oxygen
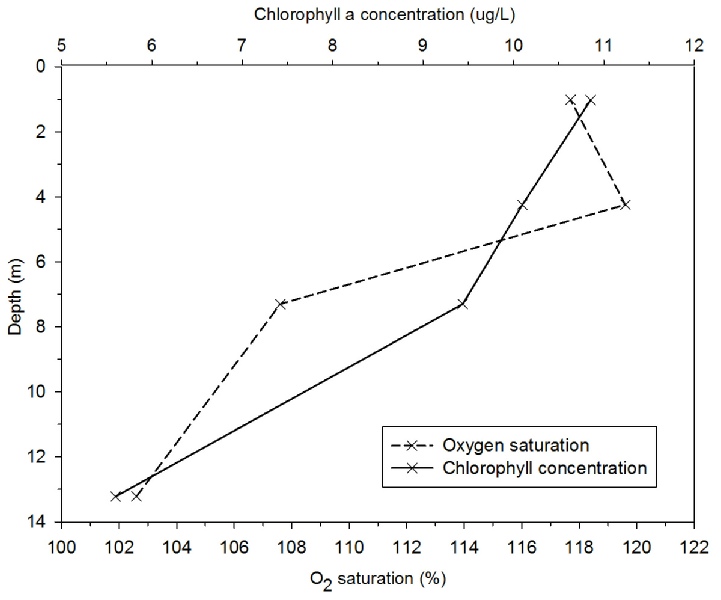
At Station 6, a comprehensive depth profile was taken, allowing study of oxygen saturation
changes throughout the water column. Oxygen saturation is high initially at the surface,
with 117% saturation at 1m depth. The general trend shows a decrease in concentration
with depth, to 102% saturation at 13m depth. The saturation peaks at 4m depth at
120% saturation, but it is expected it to be highest at the surface2 due to the immediate
contact with atmosphere allowing O2 to dissolve into the surface waters. The by-
Figure 3.5
Dissolved oxygen (%Sat) and chlorophyll (mg/L) concentrations at Station 6 in the Fal estuary.
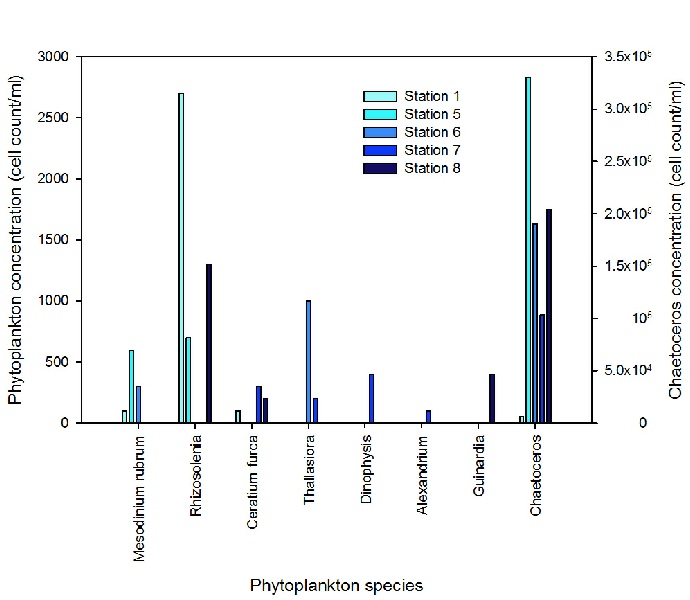
There was a clearly dominant group – the diatom taxa Chaetoceros – that was present at all Stations. Their abundance is lowest (630 cells/mL) at Station 1, and highest (33020 cells/mL) in the mid estuary at Station 5, where, further, the largest proportion of other species were present, including the dinoflagellate taxa Alexandrium and Dinophysis. This is due to the presence of essential macronutrients from the riverine source, particularly dissolved silicon, which limits diatom and dinoflagellate growth and is required for the construction of a silica test, a ‘frustule’ 3. At the seaward Station 1, nutrients are well mixed throughout the water column and, hence, less available for phytoplankton species to exploit in the surface eutrophic zone.4
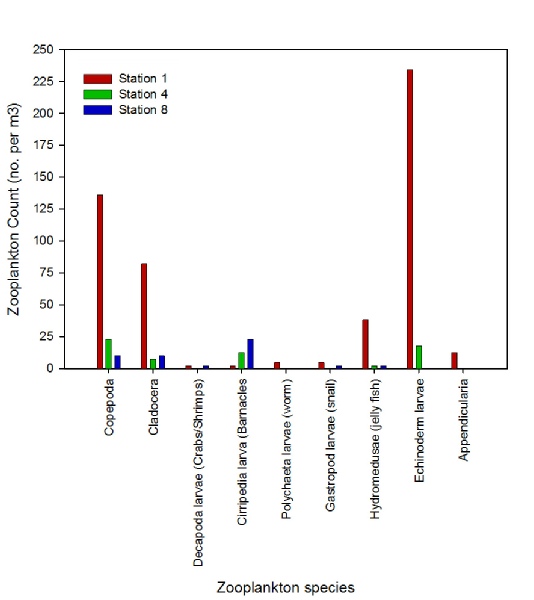
Total zooplankton numbers were found to be at their highest at Station 1 (520.4/m3 ), which was located at the mouth of the estuary. Echinoderm larva dominated in species abundance at this station (235/m3 ), followed by copepods (137/m3 ). Echinoderm larva dominated, possibly due to the exploitation of a biological niche amongst the other species.
Species diversity was also at its highest at Station 1, with 9 total species compared to 4 (Station 2) and 5 (Station 3). A larger species diversity at Station 1 could be explained by the horizontal migration of sea originated zooplankton upstream to more phytoplankton rich waters.
Total zooplankton numbers then substantially decrease at Stations 2 (64.7/m3 ) and 3 (51.60/m3 ) which are further up the estuary. This could be evidence of environmental conditions affecting species distribution at this station e.g. decreased salinity, increased temperature and decreased 02. The expected result was the increase in zooplankton correlating with the increase in phytoplankton5.
Figure 4.2
Zooplankton (cells/m3) for Stations 1, 4 and 8 in the Fal estuary.
Zooplankton
Figure 4.1
Phytoplankton (cells/mL) concentrations at successive stations in the Fal estuary.
ADCP
Successive transects along the estuary of River Fal illustrate changes in flow speed
that reflect both tidal movements and the local geography of the estuary channel.
For the early Transects 1 and 2 the respective slack tide and beginning of the ebb
tide reflects the small average flow speeds of 0.046 ms-
CTD
The surface temperature increases from 17.4°C to 19.4°C between the first and last stations due to the times at which each station’s data was recorded; each was measured at a later point in the morning and thus a warmer time of day. Temperature decreases fairly uniformly with depth, except for at Stations 6 and 8 where a relative thermocline is apparent at mid depths. This is likely due diurnal solar warming as the successive stations were taken progressively throughout the day, in addition to tidal influence affecting the stratification.
As expected, the overall salinity between Stations 1 and 8 decreases from over 35 to 34.0 at depth and 34.8 to 3.3 at the surface. This is due to increasing proportions of freshwater further up the estuary which is enhanced by the direction of travel between stations against the ebbing tide. Salinity changes with depth at most early stations were only a tenth of a unit, and therefore assumed insignificant, though still showing a general increase. At Stations 5, 6 and 8 salinity changed to a greater extent with depth (up to 1 unit) and showed stratification of the water with areas of rapid change, for example, by 0.8 in 3m at Station 6.
Chlorophyll generally increases further up the estuary as more nutrients from river
water are available alongside that of increased surface runoff, with the possible
additional influence of direct chlorophyll riverine input in detrital matter. The
chlorophyll maximum also rises from below 5m at early stations to approximately 3m
at Stations 6-
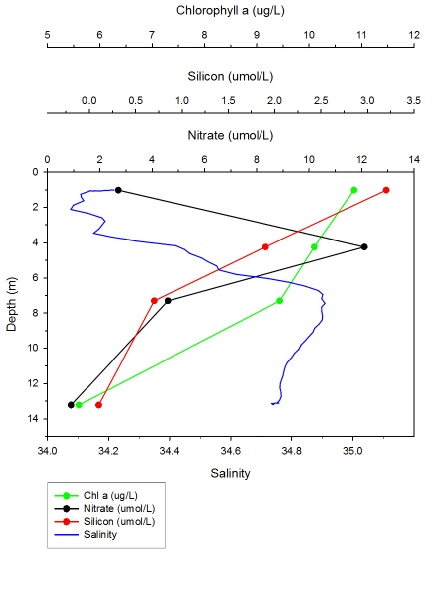
Station 1
Temperature decreases from surface to the base of the profile, with a reduction in temperature of 0.2°C, changing uniformly with depth. Salinity increases from 33.3 to 34.7, with a clear shift at the surface. Chlorophyll initially increases with depth before becoming constant.
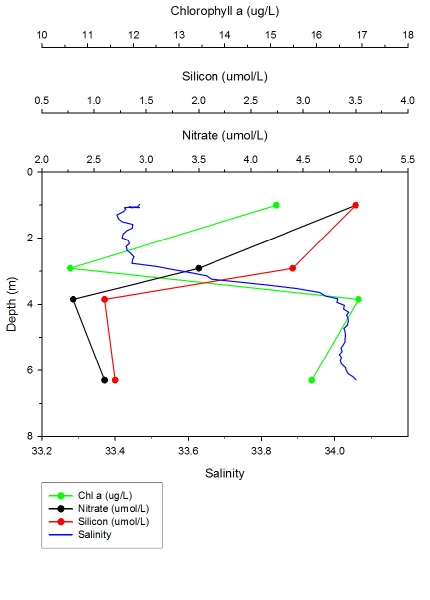
Station 2
Temperature decreases uniformly with depth from 17.7°C at the surface to 17.4°C at
the base of the profile. Salinity shows some increase with depth. Chlorophyll appears
to peak around between 5-
Figure 2.1
Salinity, temperature (°C) and chlorophyll concentration (µg/L) with depth (m) at Station 1.
Station 3
Temperature decreases from surface to the base of the profile, with a reduction in temperature of 0.5°C. Although appearing to fluctuate dramatically, the overall change in salinity is negligible here. Chlorophyll peaks around 5m before declining and becoming constant with depth.
Station 4
Temperature decreases by 0.9°C from surface to the base of profile, becoming approximately constant with depth at 13m. Salinity increases by only 0.3 and shows relatively large fluctuations. Chlorophyll peaks just above 5m before declining with depth.
Station 5
Temperature decreases uniformly with depth by 1.1°C. Meanwhile, salinity increases
by 0.4, at a rate fastest between 6-
Station 6
Temperature decreases by about a degree from top to bottom, most rapidly between
4-
Station 7
Temperature decreases relatively consistently with depth, from 18.9°C at the surface
to 18.0°C at depth. Salinity also shows a lack of stratification, declining uniformly
with depth from 34.1 to 34.6. Chlorophyll peaks between 2-
Station 8
The temperature decreases from 19.4°C to 18.5°C with depth, with a faint thermocline
between 3-
Figure 2.2
Salinity, temperature (°C) and chlorophyll concentration (µg/L) with depth (m) at Station 2.
Figure 2.3
Salinity, temperature (°C) and chlorophyll concentration (µg/L) with depth (m) at Station 3.
Figure 2.4
Salinity, temperature (°C) and chlorophyll concentration (µg/L) with depth (m) at Station 4.
Figure 2.5
Salinity, temperature (°C) and chlorophyll concentration (µg/L) with depth (m) at Station 5.
Figure 2.6
Salinity, temperature (°C) and chlorophyll concentration (µg/L) with depth (m) at Station 6.
Figure 2.7
Salinity, temperature (°C) and chlorophyll concentration (µg/L) with depth (m) at Station 7.
Figure 2.8
Salinity, temperature (°C) and chlorophyll concentration (µg/L) with depth (m) at Station 8.
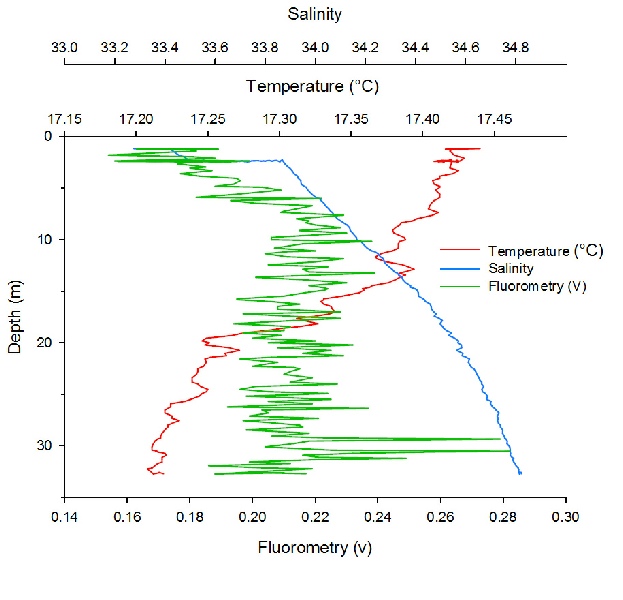
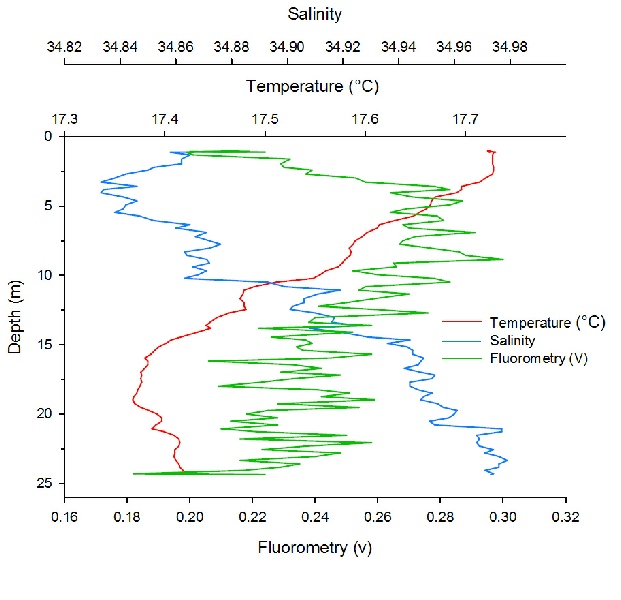
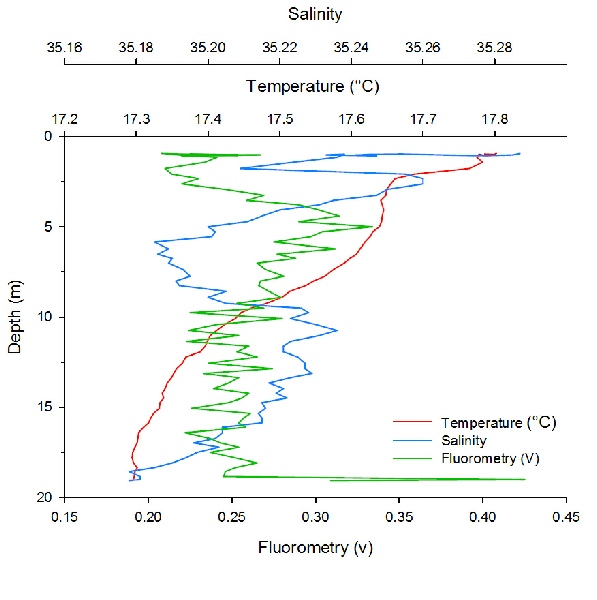
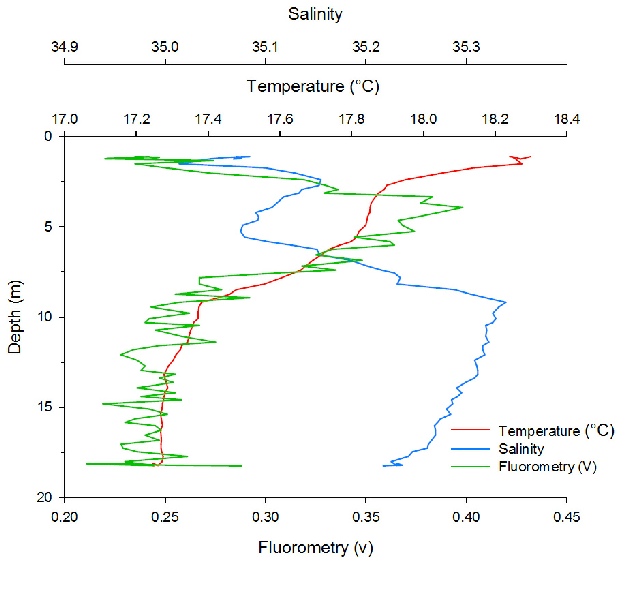
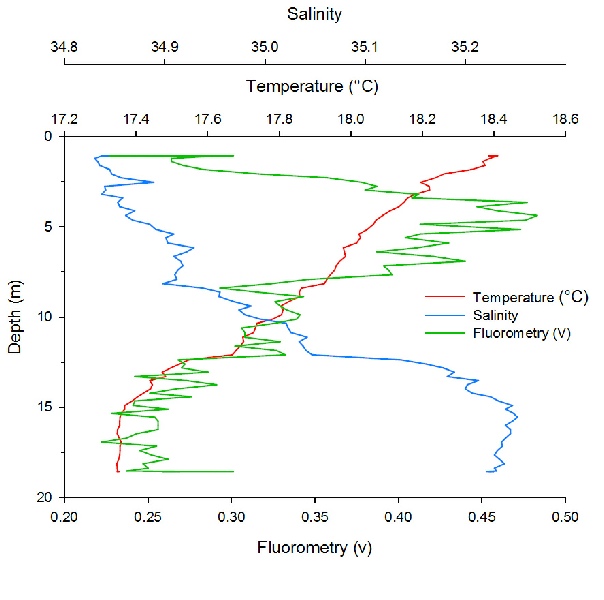
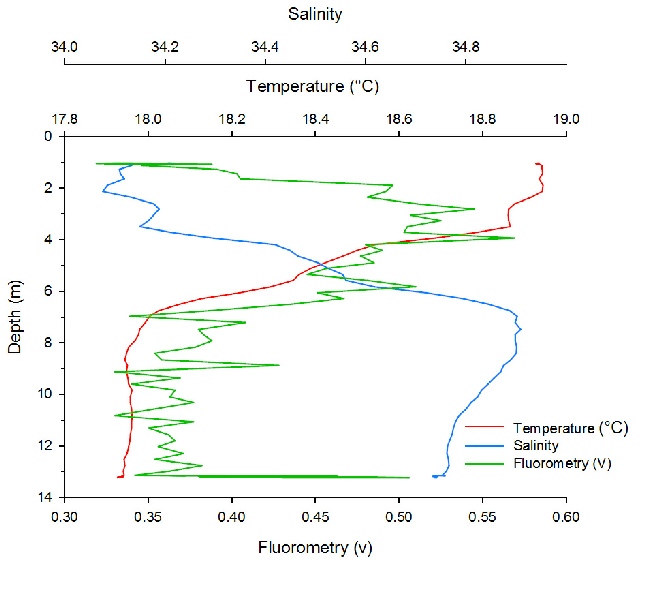
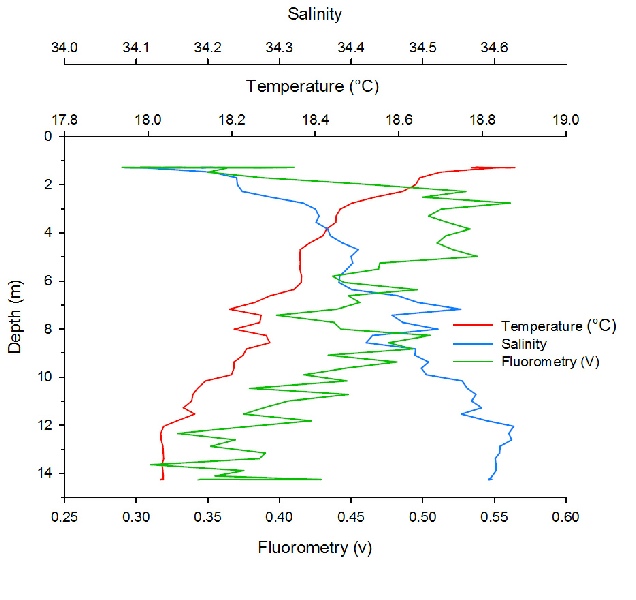
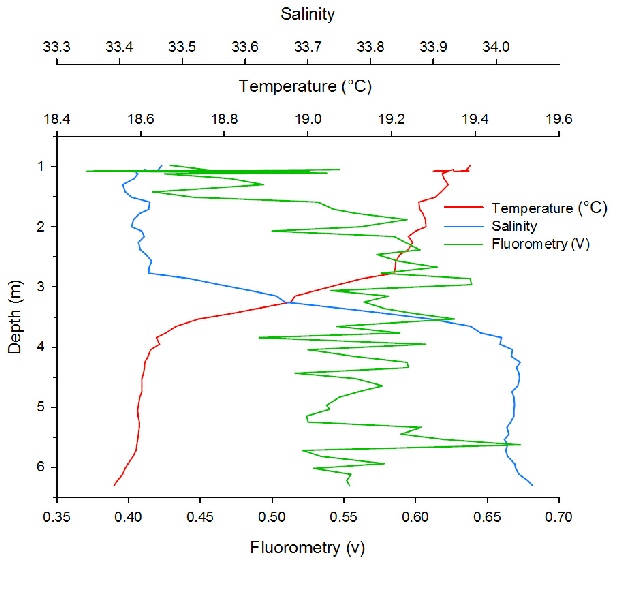
Figure 1.0
Google Earth image of positions of sampling Stations 1-
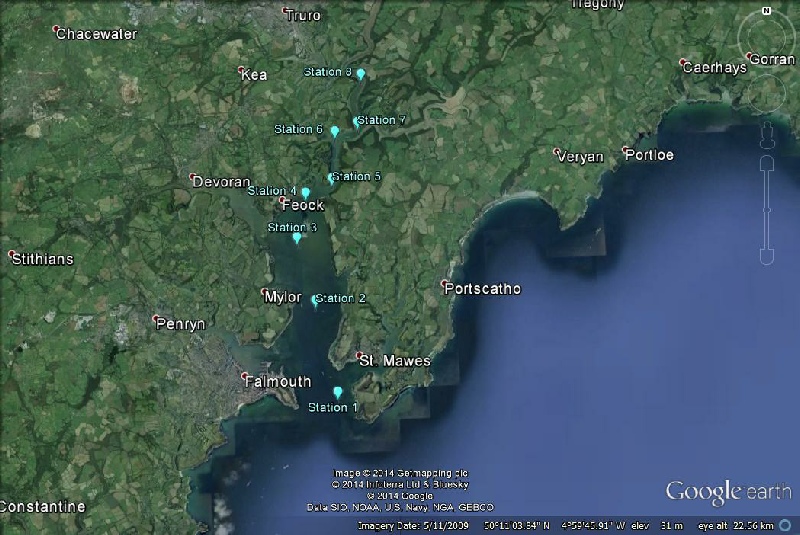
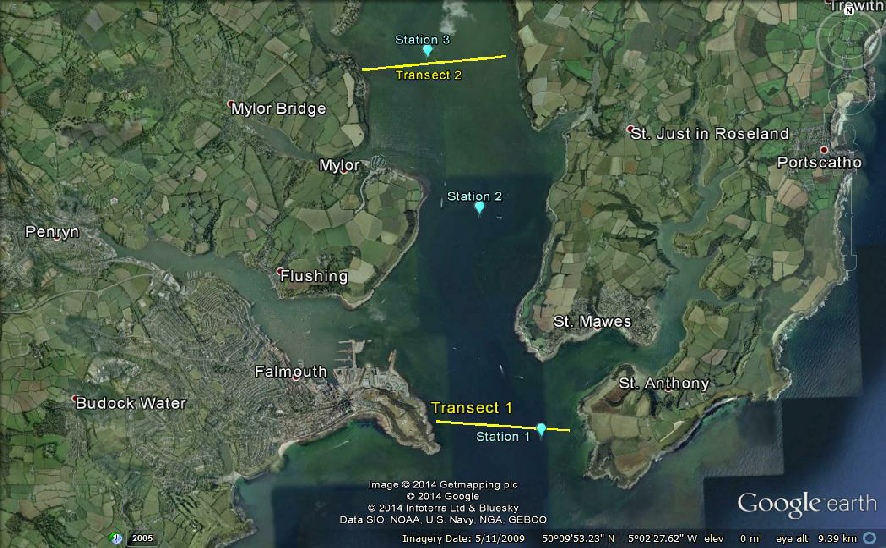
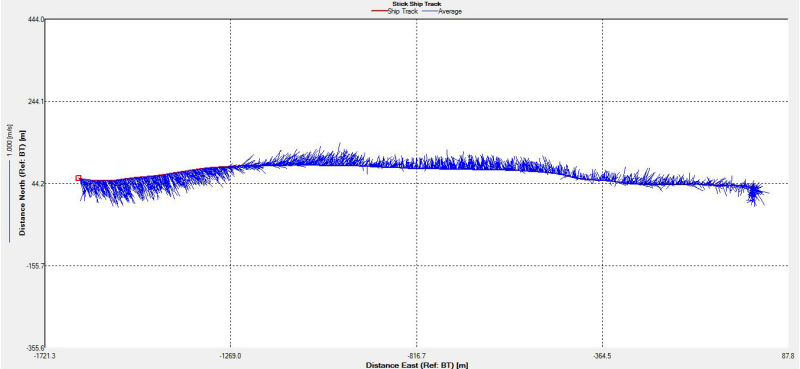
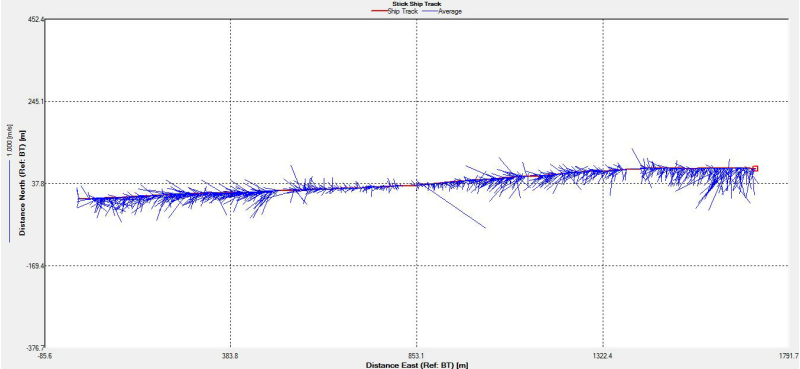
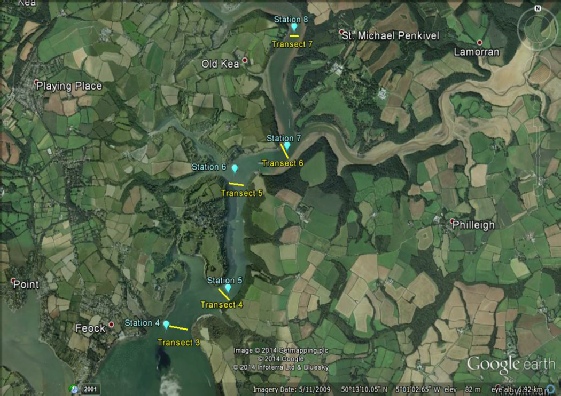
Figure 3.1
Google Earth image of positions of Stations 1-
Station Time Latitude Longitude Water Depth Wind Velocity Wind
direction Secchi Disc Depth Octaves of Cloud (UTC) (m) (ms-
1 0740 50°08.695 005°01.413 36.9 4.4 254.6° 7.40 1/8
2 0833 50°10.287 005°02.087 27.0 4.9 242.3° 6.13 1/8
3 0852 50°04.406 005°02.623 21.2 5.0 257.6°
4 0917 50°12.204 005°02.416 20.6 3.5 233.8° 4.15 1/4
5 0942 50°12.466 005°01.694 20.4 5.4 230.4° 4.44 1/4
6 1017 50°13.326 005°01.604 15.8 3.0 182.7° 2.11 1/2
7 1045 50°13.500 005°00.971 18.3 3.2 229.1° 2.38 1/8
8 1112 50°14.392 005°00.882 7.2 2.3 210.6° 1.60 3/4
Station 6 was positioned further up estuary around halfway between Station 4 and Station 8. Similar to Station 4 salinity changes are discreet with depth. Overall salinity is increasing with depth. Chlorophyll remains highest within the upper surface of the water column at ≈11 g/L and decreases with depth. Nutrients appear to be highest within the least saline part of the water column. Nitrate is most depleted at the surface, likely due to it being utilised by primary producers; whereas silicon continues to increase, suggesting a possible absence of siliceous phytoplankton.
Figure 3.2
Silicon (µmol/L), phosphate (µmol/L), nitrate (µmol/L), and fluorometry (V) concentrations at Station 6 in the Fal estuary.
Station 8 was the top-
Figure 3.3
Silicon (µmol/L), phosphate (µmol/L) nitrate (µmol/L), and fluorometry (V) concentrations at Station 8 in the Fal estuary.
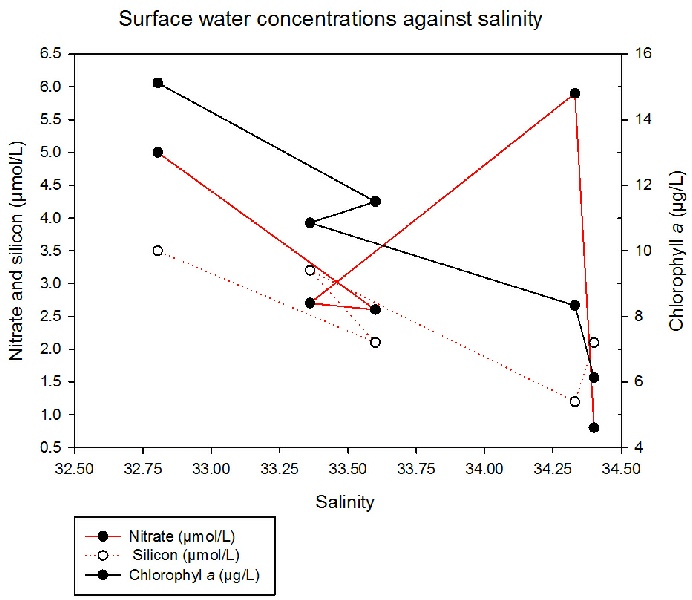
Surface silicon concentrations decreased with increasing salinity. This is as expected, as the river water with a higher concentration of silicon is diluted by seawater with a lower concentration. Concentration of nitrate showed an overall decrease with increasing salinity, apart from at one station (Station 5) where relatively high nitrate concentrations were present at high salinities. This may be due to increased surface run off from the nearby creek but may also be anomalous. The overall decrease is likely caused by biological removal as plankton from the seawater mixes with the riverine freshwater. Phosphate concentration in the surface water was negligible (less than 0.01 µg/L) indicating that it may be limiting primary production, as is often the case in the estuarine environment1. Chlorophyll concentration decreased with increasing salinity, indicating favourable conditions for primary production further upstream. The fall in chlorophyll is likely associated with decreasing nutrients.
Figure 3.4
Silicon (µmol/L), phosphate (µmol/L) nitrate (µmol/L), and fluorometry (V) concentrations at Station 8 in the Fal estuary.