
Meta data
Date: 26/06/2014
Time: 08:30-
Location: 50 12.57’N 005 01.37’W
Weather: 8/8 cloud cover, light to heavy rain, reasonable winds
High tide: 05:20 4.6m
Low Tide: 12:04 0.9m
Methods
Vale Port Curent meter:
Current meter placeed in water to activate (
Pontoon methods
Sampling was taken from three stations on the pontoon; YSI probe, current meter and water sampling. Sampling was taken at each station every half an hour from 09:30 – 13:00 at 1m intervals until the maximum possible sampling depth.
YSI probe
The YSI probe measures temperature, salinity, pH, NTU (turbidity), % oxygen, mg oxygen,
and voltage.
The probe is attached to the pontoon, and submerged by the water at all
times to avoid potential damage.
The maximum depth limit was given from information
by the current meter, so that the probe did not touch the bottom sediment.
Current meter
The current meter was placed just below the water surface to activate the receiver
(which is activated by salt water electrophoresis. A surface reading of current and
velocity were taken, before the probe was lowered at 1m intervals, taking a reading
at each metre marked on the cable.
This process was then repeated until the probe
reached the bottom, where it was removed from the water column. Readings were taken
every 30 minutes from the same location.
Water Sampling
Every 30 minutes, two 50 ml water samples were taken from the surface water, using
a syringe. The water samples were then passed through a filter by applying pressure
through the syringe. The pressure was not so hard as to break the paper filter. The
filter paper from each sample was then placed in a labelled test tube filled with
acetone, and stored for analysis.
The acetone solutions were then analysed for chlorophyll
content using a fluorometer.
Overview
The King Harry pontoon along the Fal estuary was surveyed using a YSI multi-
The data collected was used to create a time-
Results
Contour plots are not continuous, data was taken every half an hour, at every metre until a metre above maximum depth.
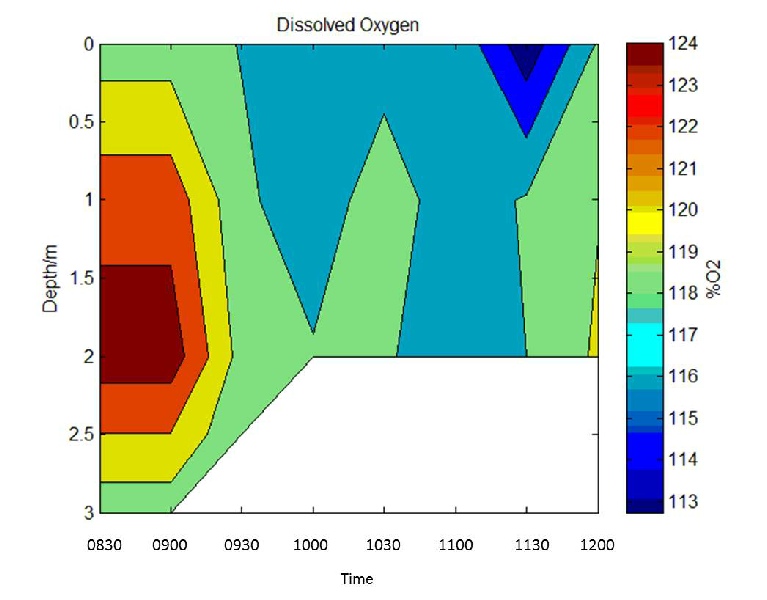
Dissolved oxygen
At 8:30am when sampling started the highest values of dissolved oxygen were recorded
between 1.4 – 2.2m, with 124% O2. These values decreased with proximity to the surface
and bottom of the water column. As sampling continued throughout the morning, the
depth of the water decreased due to the low water tide, as did the % O2 recorded.
The minimum % O2 recorded occurred later in the sampling period; at 11:30am and between
0-
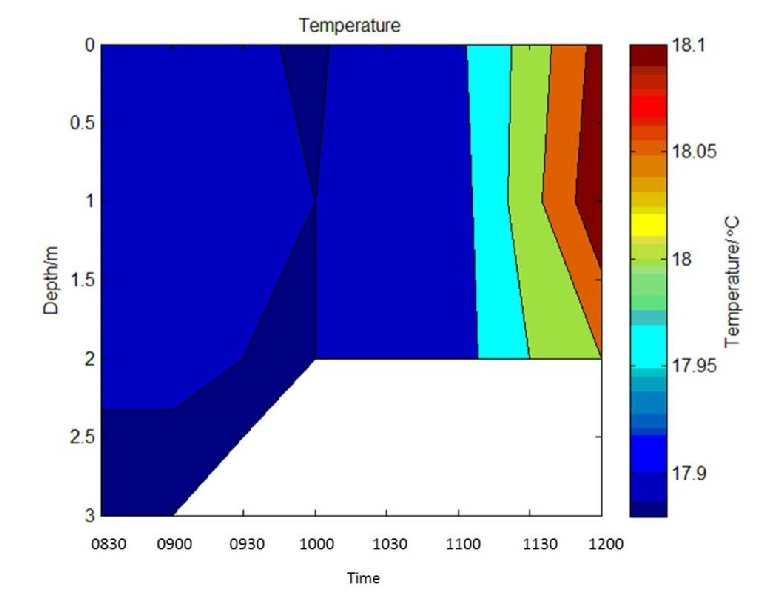
Temperature
When sampling began at 8:30 UTC water temperatures were recorded between 17.87°C at depth and at 17.92°C above 2.3m to the surface. At 10:00 UTC there is a brief period where the complete water column is at 17.87°C as low tide approaches and the cold bottom water is brought closer to the surface. From 11:00 UTC the water column as a whole starts to increase in every half an hour sample until 12:00 UTC where the top metre of the water column reaches 18.1°C.
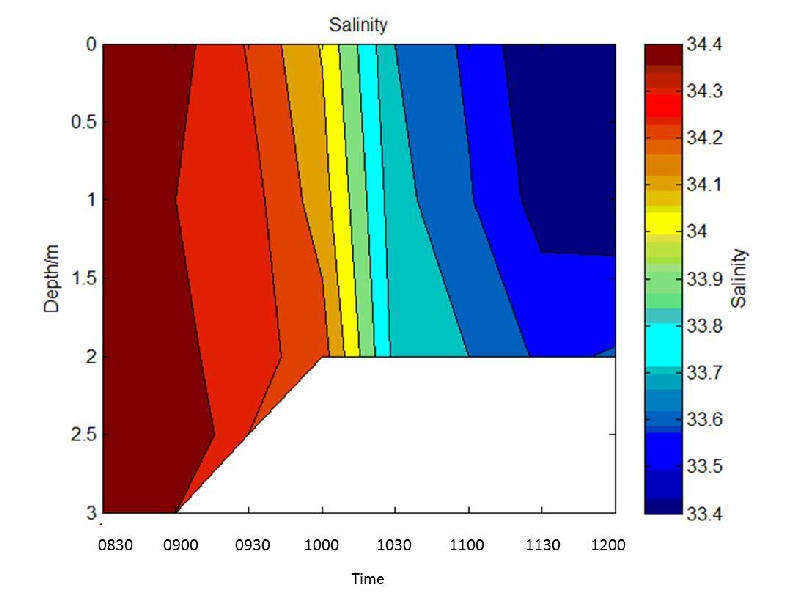
Salinity
The salinity recorded off the pontoon are mainly consistent with depth, suggesting a mixed water column. When sampling begins, salinity is highest at 34.4 and decreases by 0.1 every half an hour until 10:00am where a more sudden decrease occurs of 0.4 in half an hour. The decrease in salinity then returns to a steadier decline and reaches a salinity of 33.4 in the top 1.5m of the water column at 12:00 UTC. This decline in salinity with time is most likely to be due to the tide going out with low water at 12:04 UTC.
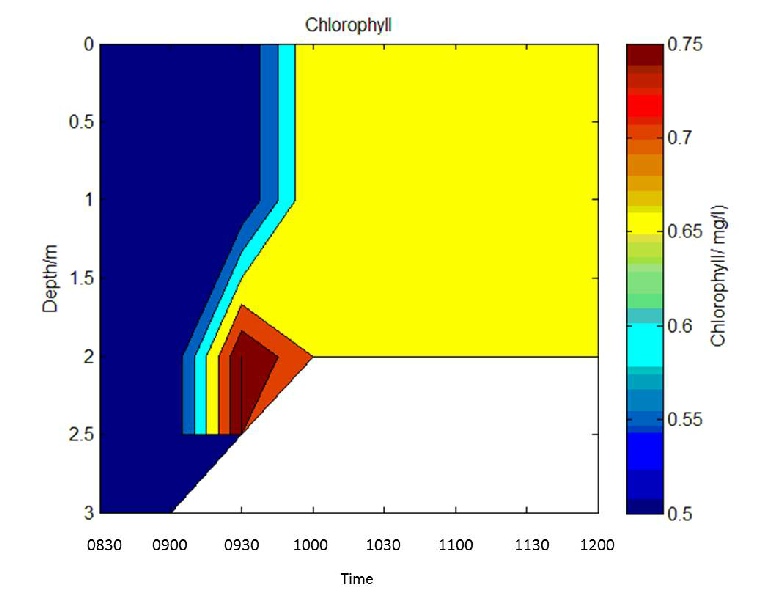
Chlorophyll
From 8:30 – 9:00 UTC the recorded values of chlorophyll are lowest and consistent throughout the whole water column. From 9:00 – 9:45 UTC there is an increase in chlorophyll concentrations from 0.5mg/l to 0.69mg/l at 2m and an increase to 0.6mg/l between the surface and 1m depth. From 10:00 – 12:00 UTC the chlorophyll concentration remained constant with depth and time at 0.65mg/l.

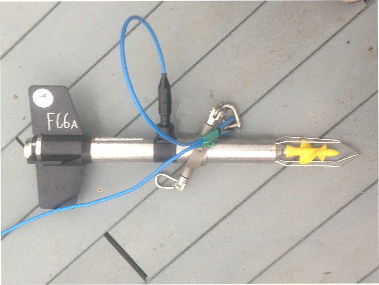
Figure 1: Current meter