


Meta Data
Date: 28/06/14
Location: King Harry’s Ferry Pontoon 50o13’0.2274, -
Time (UTC): 08:30 – 11:30
High Tide: 05:42UTC (4.8m), 17:56UTC(5.0m)
Low Tide: 12:25UTC (0.8m)
Time UTC Max Depth (m) Cloud Cover (octants)
08:30 4.8 4
09:00 4.5 4
09:30 3.9 6
10:00 3.3 6
10:30 3.0 5
11:00 2.7 7
11:30 2.7 -
Table cont.
Wind Conditions Weather
Light Light Rain
Light Slightly Overcast
Light Sunny
Light Sunny
Light Heavy Rainfall
Light Heavy Rainfall
-

The King Harry Ferry Pontoon is located in the Fal River on the South Coast of Cornwall.
Using the pontoon, the physiological parameters of the water column were studied
as the tide ebbed, decreasing the depth of the water column, and changing its features.
It was noted that all factors observed changed with the tide, and suggested-
The pontoon is on the River Fal, just before it enters the estuary. Due to the distance along the river from the mouth of the estuary (17km inland), (Tappin et al, 2010), the tidal height will be much less than the spring high tide at the coast (5.3m) yet will most likely be more than the tidal height of Truro (3.5m) (Pirrie et al, 2003). Depending on the tidal height the water column will either be highly stratified, moderately stratified or vertically homogenous, (Haas, 1977).
By sampling in one location every half an hour it was possible to create a time series to show changes in one point with changing time, and therefore changing tidal state (high tide to low tide in this study). By measuring depth, temperature, salinity, pH, Chlorophyll concentration, percentage of dissolved oxygen, concentration of dissolved oxygen and turbidity has allowed us to produce time series.
YSI Probe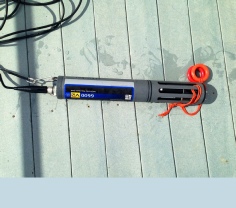
The YSI probe was lowered close to the estuarine bed (determined before each reading due to the changing tide heights), taking measurements at 1m intervals from the surface (with the final reading on a half metre when the depth is too shallow). It recorded temperature (°C), salinity (PSU), pH, chlorophyll concentration (µg/L), % dissolved O2, dissolved oxygen concentration (µg/L) and turbidity (NTUs).
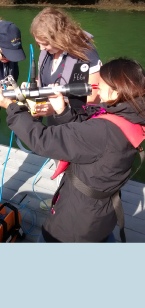 Valeport Current Meter
The current meter recorded the direction and speed (ms-
Chlorophyll Analysis
Two 60ml water samples were taken from near the surface and then filtered using glass-
The pontoon was open for leisure craft to use so we occasionally needed to sample in different points on the pontoon. As it is small this shouldn’t greatly affect the accuracy of the results, but the presence of boats may have slightly disrupted the current data.
Due to time restrictions a full tidal cycle couldn’t be measured but this could be pieced together using data from other groups.
Due to human error, the chlorophyll samples were not able to be used.
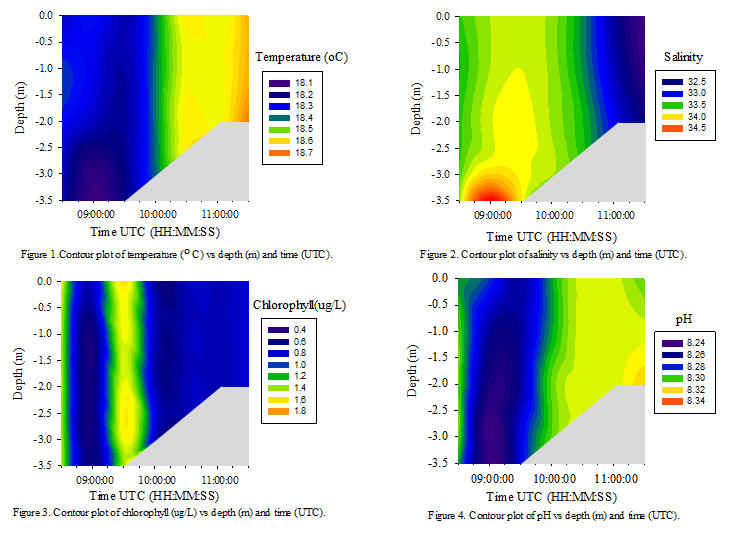
From figure 1 it can be seen that temperature varies little with depth but over time the temperature increases throughout the water column. The maximum temperature of 18.7oC is reached at 11:30 UTC.
Figure 2 shows that the salinity of the water column decreases with time. The salinity maximum of 34.5 occurs at 09:00 UTC at 3.5m. At 10:00 UTC the salinity begins to decrease with time, but remains constant with depth, and the minimum salinity of 32 is reached at 11:30 UTC.
It can be seen from figure 3 that the chlorophyll concentration varies very little with depth. There is a spike in the chlorophyll concentration from 0.8ug/L to 1.6ug/L at 09:30 UTC, but the concentration then decreases to between 0.6ug/L and 0.4ug/L and remains relatively constant with depth and time from 10:30 UTC onwards.
Figure 4 shows that the pH of the water column increases over time. The largest increase occurs between 09:30 UTC and 10:00 UTC where pH changes from 8.24 to 8.30. The pH continues to increase between 10:00 UTC to 10:30 UTC, peaking at 8.31. The pH then remains relatively constant with depth and time, and only varies slightly with depth at 11:30 UTC, where a higher pH of 8.32 is witnessed at 2.0m compared to 8.30 at the surface.
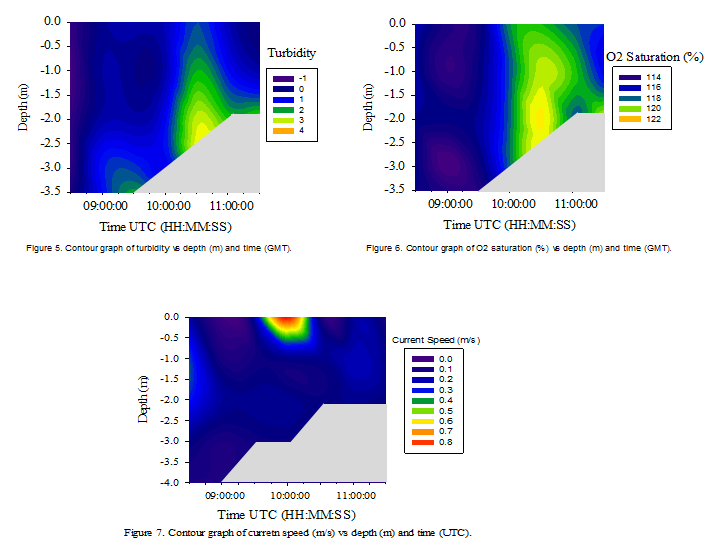
Figure 5 shows that the turbidity of the water column is lowest at 0 NTU to 1 NTU between 08:30 UTC and 09:00 UTC and changes little with depth during this time. At 09:30 UTC an increase of about 1 NTU can be seen between 3.0m and 3.5m but this is a relatively small change in comparison with the change in turbidity seen at 10:30 UTC, where turbidity increases from approximately 1 NTU to 3 NTU between 10:00 UTC and 10:30 UTC. From 11:00 UTC the turbidity decreases but remains slightly higher at the sea floor (2 NTU) than the surface (0 NTU).
Figure 6 shows that O2 saturation is between 115% between 08:30 UTC and 10:00 UTC and does not vary significantly with depth; however areas of slightly lower saturations of 114% can be seen at 3.0m and 1.0m at 09:00 UTC. At 10:00 UTC the O2 saturation increases throughout the water column, with higher O2 saturations of approximately 120% seen closer to the sea bed, compared with 116% at the surface.
Figure 7 shows that the current speed varies very little with time and depth. The current speed remains between 0.0m/s and 0.3m/s for the entire time period over all depths, apart from at 10:00 UTC where the current speed significantly increased between 0.0m and 0.5m, with the maximum current speed of 0.8m/s occurring at the surface.
The investigation into how tide affects oceanographic parameters was carried out during an ebb tide. From figures 1 and 2 it can be seen that the temperature increases with time and salinity decreases with time. This demonstrates that the warmer, less saline water from the upper estuary is flushing seaward towards the mouth of the estuary. This is supported from investigations into the estuary conducted on the 1/06/14 (link to estuary) as the data shows that the water further up the estuary is warmer and less saline than water at the mouth of the estuary. The results seen in figures 1 and 2 are a consequence of the Ebb tide causing the sea water to move out of the estuary and the river water to move down towards the mouth of the estuary. In figure 2, you can clearly see a minor salt wedge between 3.0m and 3.5m at 09:00 UTC. As the tide ebbs, this salt wedge is moved down stream, and replaced by the lower salinity waters of the upper estuary of the Fal River.
The effect of the Ebb tide on the pH can be seen in figure 4 where the pH increases with time, where the sea water flushes out of the estuary and the river water moves towards the mouth of the estuary. There is a higher concentration of bicarbonate ions in sea water than river water, which causes the pH of sea water to be lower than river water.
The lower pH water seen at 09:00 between 3.0m and 3.5m supports the data seen on figure 1 and 2, where a minor salt edge is seen. The cooler, more acidic and more saline sea water, is sitting below the warmer, less acidic and less saline river water. Figure 6 also supports this, showing lower oxygen saturation levels where the salt wedge is seen. Figure 6 also shows significantly higher O2 saturation levels between 10:00 UTC and 11:00 UTC where the river water is flushing down the estuary, which contains a higher O2 concentration.
From the data gathered, it can be concluded that the River Fal is dominated by coastal flux. This is supported by the salinity of the water column during low tide, when the estuary is least influenced by coastal waters. Figure 2 shows that the salinity of the water column, remains relatively high (in excess of 30) and despite the ebbing tide, continues to remain so. This suggests the sea water penetrates far up the estuary, causing the increased salinity. However the salinity values obtained, could have been affected by the period of very dry weather that was experienced in the weeks before the investigation was conducted.
References
Pirrie, D., Power, M. R., Rollinson, G., Camm, G. S., Hughes, S. H., Butcher, A.
R., & Hughes, P. (2003). The spatial distribution and source of arsenic, copper,
tin and zinc within the surface sediments of the Fal Estuary, Cornwall, UK. Sedimentology, 50(3),
579 -
Tappin, A. D., Barriada, J. L., Braungardt, C. B., Evans, E. H., Patey, M. D., &
Achterberg, E. P. (2010). Dissolved silver in European estuarine and coastal waters. Water
research, 44(14), 4204 -
Haas, L. W. (1977). The effect of the spring-
Image A | YSI Probe.
Image B | Valeport Current Meter being set up.
Disclaimer-