


Using a Sidescan Sonar, a habitat map of St. Mawes Harbour (Falmouth, Cornwall) was created. The map was then studied and utilising video transects of the area, the distinct areas on the sidescan were identified and assigned. What could be seen was the kelp, seagrass (eelgrass) and seaweed dominated the environment where there was epifauna, though some spaces had little epifauna, instead suggested a wealth of infauna. Pylaiella littoralis, a fast growing filamentous macroalgae, which is potentially a danger to many rarer algal species was also present.
During the field course, we set out to look at the seafloor habitat distribution in a Special Area of Conservation (SAC) site within the Carrick roads region of the Falmouth Estuary in Cornwall, UK. The survey site was located in an area of St Mawes Harbour at the end of the Percuil River and has many ecologically important habitats. It includes live maerl (Hardiman et al, 1976) and eelgrass (Zostera marina) beds (Royal Haskoning, 2009) as well as nursery and spawning grounds for other species; cuttlefish (Sepia officinalis), sea hares (Aplysia punctate) and sticklebacks (Spinachia spinachia), (Deeble and Stone, 1985). To fully understand the importance of the habitat interactions, analysis of the habitats and their distributions are needed for the area of interest. Many factors influence seafloor habitats, most prominent of which are the water quality and physical parameters of the water column (Diaz et al., 2004). The aim of this survey was to create a detailed habitat map of the St Mawes Habour, using a Side Scan Sonar (SSS) and in situ video recording to assess habitat distributions.
This survey was carried out to allow analysis of the habitat distributions of the area. Our hypothesis is to find extensive areas of eelgrass as well as maerl beds giving habitats to multiple species.
Sidescan Transect
Once the area of interest had been identified, a series of four parallel survey lines were planned in order to cover as much of the area as possible. Using the survey vessel MTS Xplorer, a side scan profile of each transect was then conducted using a towed fish.
Video Transect
Three video transects were planned to intersect with the four side scan transects. A camera mounted on a plastic frame (in order to stabilise the image) was lowered into the water until just above the estuary bed and hauled along while the boat drifted across the transect, giving footage of the benthic habitat in each section.
Habitat Map
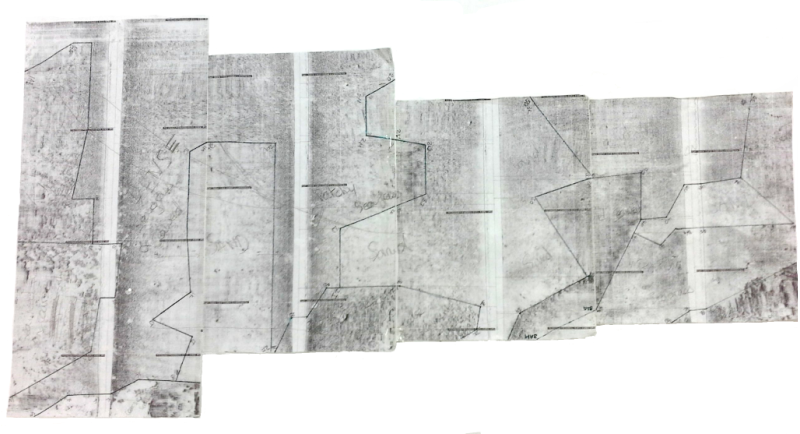
The first step in the creation of the habitat map was to align the four side scan
print outs and combine them to create one image of the whole survey area. Major habitat
boundaries were then marked on this print out with the position of each line in relation
to the towed-
The sidescan sonar plot (Fig. 1) allowed us to draw boundaries between different areas of the benthos by the reflection of the substrate and life on the benthos. The sidescan on its own doesn’t give us a lot of information about the benthic structure as there are no obvious bedforms or areas of contrasting high and low reflection associated with rocky outcrops or dunes. From this it is safe to assume a relatively flat benthos with the exception of a possible sand bank along the centre.
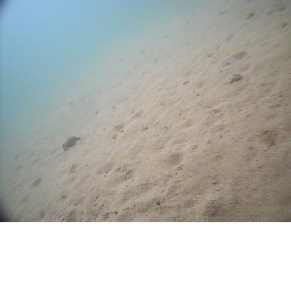
Video trawls were used to get a better impression of the benthic environment. Fig. 2, 3 and 4 are screenshots from the video transects. Fig 2 is the sandy habitat which showed little to no flora and only the occasional shore crab (Carcinus maenas) were spotted. There are many pits and disturbances to the upper sediment that are likely to be caused by infaunal species.
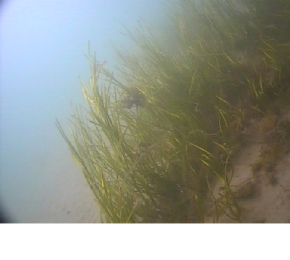
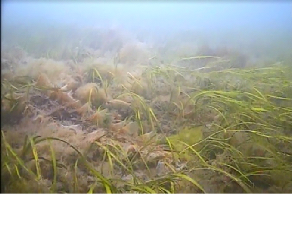
Fig. 3 is an image of the Eelgrass beds that were found. These areas showed a couple of unidentified small fish but other than that the populations of this environment was almost exclusively the seagrass. This is in great contrast to Fig. 4 which is the mixed seaweed habitat including seagrass, kelps and filamentous macroalgae (Pylaiella littoralis).
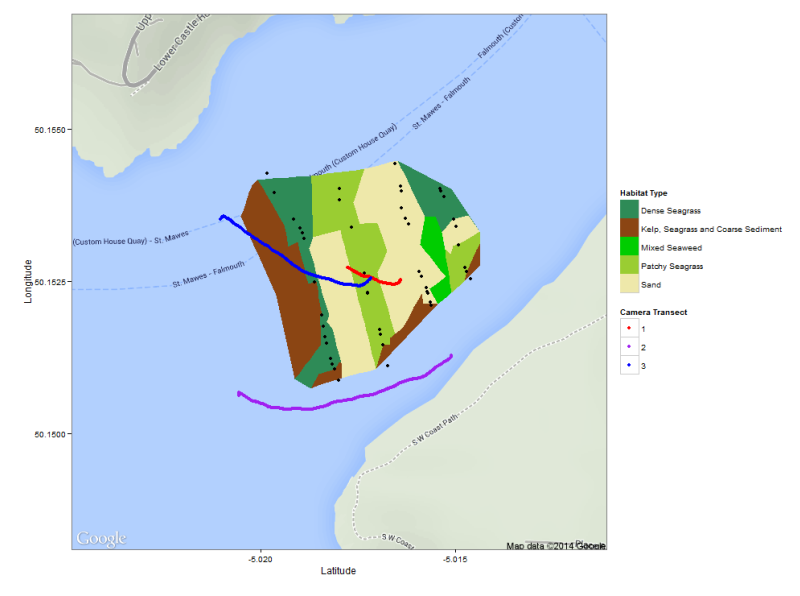
From a combination of the sidescan and the videos we were able to identify the habitat types showing up on the sidescan with confidence as the video transects covered at least one area of each type. Fig. 5 and 6 are the results of this. In the centre of the maps there is a lot of sand and sparse seagrass. This is open to speculation that there is a sandbank in this bay possibly caused by tidal sediment transport. This could also be the activity of boats anchoring disrupting the seabed, affecting recruitment of benthic flora.
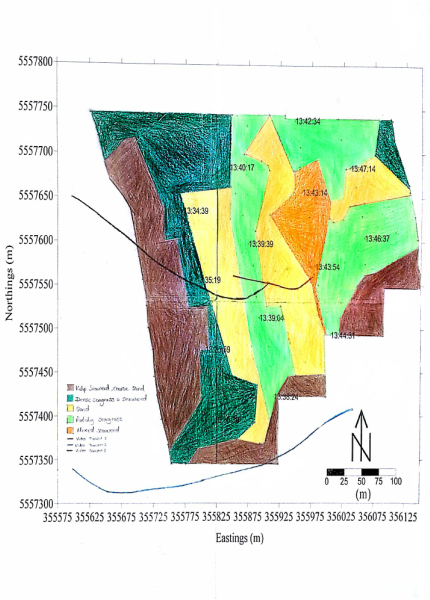
From the Track plot, 5 different benthic habitats can be seen. The area is dominated by mixed seaweeds, sea grasses and kelps, with sand contributing to the remainder of the surveyed area. Fig. 2 showed very little epibenthic activity with the exception of a few shore crabs. This is due to the lack of shelter and the instability of the sediment caused by the absence of sea grass, which contributes to stabilising the sediment. The sea grass attenuates wave energy which increases deposition and suppresses resuspension of suspended particulate material (Ward et al. 1984). However there is significant evidence for a vast and varied infaunal community. This is similar to the patchy seagrass habitat which is a combination of Fig. 2 and 3, where the seagrass provides some shelter for epibenthic fauna but it is likely that the infaunal community dominate the habitat.
From the benthic map we can infer possible characteristics of the water column. For example seagrass requires salinity in excess of 5‰ in order to fully develop (Duarte 2002). The habitat in Fig. 4 is dominated by dense seagrass, we can infer that the salinity of the water column is above 5‰. This is to be expected as it’s located very close to the mouth of the estuary where salinity would not be expected to drop significantly. Seagrass is able to grow under a wide range of temperatures (approximately 6oC – 30oc) (Bulthuis 1987) which allows it to grow alongside kelp and other macro algae as seen in areas of dense seagrass and seaweed. This provides significant shelter for epibenthic fauna and acts as a nursery for juveniles. They are also important for nutrient recycling, detrital production and sediment stabilisation (Heck 2003). This is also seen in Fig. 4, which consists of mixed seaweeds which act as shelter. It is the ability of seagrass and seaweed to sustain these healthy populations that prompted the government to designate the area a SAC.
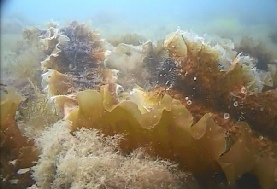
The habitat in Fig. 5 is dominated by kelp which would indicate that the water column
above is rich in nutrients, as kelp thrives in cold, nutrient rich waters. Several
genus’s, including Ulva and the filamentous macroalgae Pylaiella littoralis, were
identified on the video transects. They can grow quickly and form dense networks,
outcompeting seagrasses and other flora and blocking the path of light to the estuary
bed. Their growth can also indicate the presence of excess nutrients as they are
often responsible for algal blooms, causing eutrophication. Parts of the Fal and
Helford estuary are subject to eutrophication -
The investigation was limited by several factors. Firstly, St Mawes is located within a Special Area of Conservation (SAC). This prevents physical sampling of the sea bed; therefore grab samples could not be taken. Subsequently a size scale of the sediments and benthic flora could not be obtained. Evidence of infauna was found, however could not be sampled due to the prohibition of grab sampling. The area in which the transects were taken was also limited by other vessels, moored buoys and the shore, as they restricted the path the boat could take. The video transects used to support the interpretation of the sidescan could not be taken over the entire area surveyed, so assumptions were made from the sidescan data to map the benthos where video footage was not available. Adjustments were made to the track plot based on overlap of the map and the assumptions inferred from the sidescan data. These assumptions decrease the accuracy of the track plot, but were necessary in order to produce an overall map of the benthos.
References
Bulthuis, D. A. (1987) Effects of temperature on photosynthesis and growth of seagrasses. Aquatic Botany, 27, 27 – 40 pp.
Deele, M. and Stone, V. (1985). A port that could threathen marine life in England’s Fal Estuary. Oryx. 19 (2), 74 – 78 pp.
Diax, J D., Solan, M. and Valente, R. M. (2004). A review of approaches for classifying benthic habitats and evaluating habitat quality. Journal of Environmental Management. 73, 165 – 181 pp.
Duarte, C. M. (2002). The future of seagrass meadows. Environmental Conservation, 29, 192 – 206 pp.
Hardiman, P.A., Rolfe, M.S. & White, I.C. (1976) Lithothamnion studies off the south west coast of England. Report to the Fisheries Improvement Committee. International Council for the Exploration of the Sea (C.M Papers and reports), CM 1976/K: 9, 13 pp.
Heck Jr., K. L., Hays, G., Orth, J. J. (2003) Critical evaluation of the nursery
role hypothesis for seagrass meadows. Mar Ecol Prog Ser, 253, 123 -
JNCC. (2014). UK SAC site list. Available: http://jncc.defra.gov.uk/protectedsites/sacselection/sac.asp?EUCode=UK0013112. Last accessed 26th June 2014.
Langston, W. J., Chesman, B. S., Burt, G. R., Hawkins, S. J., Readman, J., Worsfold, P. (2003) Site Characterisation of the South West European Marine Sites: Fal and Helford cSAC. Plymouth: Plymouth Marine Science Partnership, v pp.
Lazzari and Stone. Use of submerged aquatic vegetation as habitat by young-
Pirrie, D et al. (2003). The spatial distribution and source of arsenic, copper,
tin and zinc within the surface sediments of the Fal Estuary, Cornwall, UK. Sedimentology.
50 (3), 579 -
Royal Haskoning, (2009). Port of Falmouth Development initiative. pp.181.
Sogard, S. and Able, K. (1991). A comparison of eelgrass, sea lettuce macroalgae,
and marsh creeks as habitats for epibenthic fishes and decapods. Estuarine, Coastal
and Shelf Science, 33(5), 501 -
Ward, L. G., Kemp, W. M. and Boynton, W. R. (1984). The influence of waves and seagrass communities on suspended particulates in an estuarine embayment. Marine Geology, 59, 85 – 103 pp.

Meta Data
Date: 28/06/2014
Time: 08.30
Location: King Harry Pontoon
50°12’57.8”N, 005°01’39.6”W
Low Tide: 12.25 (0.8m)
High Tide: 05.42 (4.8m), 17.56 (5.0m)
Light Wind
4 octants cloud cover
(All times in UTC)
Disclaimer-
Figure 1 | Sidescan sonar plot of the benthos. Dark areas are more reflective than the lighter areas of little or no reflection. Lines are the boundaries between areas of differing reflectivity.
Figure 2 | Camera image of a sandy habitat observed in the video transect, including a shore crab (Carcinus maenas) (left).
Figure 3 | Camera image of the Eelgrass meadows (Zostera sp.).
Figure 4 | Camera image of the dense mixed seaweed including Pylaiella littoralis and Zostera sp.
Figure 5 | Camera image of mixed seaweed with no seagrass.
Figure 6 | Hand-
Figure 7 | Virtual habitat map, plotted exactly in relation to the shore overlaid onto a Google® Maps plot. Camera and sidescan track plots shown.