Fig 3.
Introduction
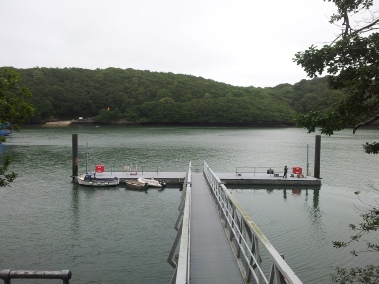
The aim of the pontoon data collection was to establish a time series of various
physical and chemical variables of the Fal River. Data was collected at King Harry’s
Pontoon on the River Fal over the time period of the 25/06/13 to 3/07/13. All 13
groups of SOES students on the 2013 Falmouth Field course participated in the compilation
of this time series. The sampling method varied from group to group due to a number
of factors, including the tidal height of the river and the instruments available
during their period of collection. Each group was allocated 4-
Conditions
Date:
Time:
Location:
Latitude:
Longitude:
Wind Speed:
Cloud Cover:
High water:
Low water:
28/06/13
8:45 -
King Harry’s Pontoon
50˚12’578N
005˚01’399W
Moderate Westerly
6/8 to 8/8
08:50 GMT
4.8m
15:20 GMT
0.6m
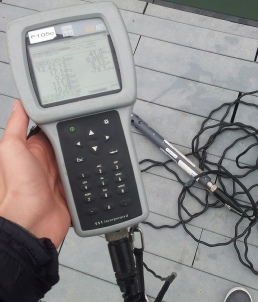
Equipment
- YSI multiprobe
- Current Meter
- Secchi Disk
- Light Meter
Methods
Measurements were taken every 30 minutes from the start time to the end of the appointed period. Firstly the Secchi disk was used to gain an approximate depth for the water column in order to determine how far the other equipment could be safely lowered. This meant that the integrity of the data wasn’t corrupted by the accidental running of instruments into the river bed.
YSI multiprobe:
The YSI multiprobe measured temperature (°C), salinity, dissolved oxygen (%), oxygen (mg/L) and pH. The probe also measures depth (m) or pressure (db), however this function was not available on the morning of the 28/06/13. Data was collected at meter intervals from the surface to the riverbed by lowering the probe a set distance, using marks space 1m apart on the probes cable.
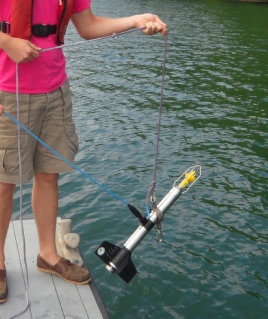
Current Meter:
The current meter combined a measurement of the flow of the water in m/s with the direction of flow in the form of a bearing (degrees). Readings were taken just below the surface, so that the whole instrument was submerged to the mark indicated. And also at 1m, indicated by a mark on the cable used to lower it into the water.
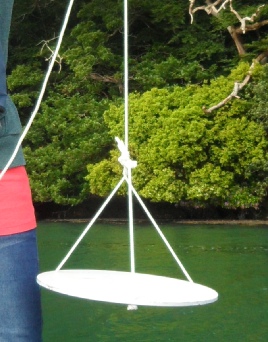
Secchi Disk:
The Secchi disk was lowered 3 times to a depth where it was no longer visible from the surface. An average of these three attempts was taken and later used to determine the light penetration of the water column. One person lowered the disk into the water and another stood by to collaborate on when the disk was no longer visible.
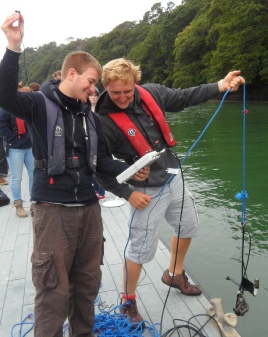
Light Meter:
The light meter had two light probes which measured light intensity in UM. One of the probes had a weight attached and could be lowered through the water column via a rope, while the other remained at the surface. Using this instrument light intensity was measured simultaneously at the surface and at set depths within the water column, usually at 1m intervals form the surface to the river bed. The data was then used to see the attenuation of light within the river water column.
Data
Note
The results displayed focus on data collected on the 28/06/13, which is representative of the data groups 13 and 9 contributed to the final time series. Some results that incorporate data collected on other days are included to give a better understanding of the variation over the time period.
Temperature and Salinity
Figure 1 clearly displays an increase in temperature over the six hour period. The temperature in the morning was 14.4°C at the surface and 13.6°C at the river bed. The temperature was constant until around 11:15 where warming of the entire water column can be seen. At 13:15 the water temperature of the entire water column increased rapidly to 15.0˚C throughout. Towards the afternoon, further warming of the surface waters occurred reaching a high of 16.6°C at 15:15. An apparent lag in the heating of the water closer to the river bed is visible after 13:00.
Figure 2 shows a visible increase in salinity throughout the water column, between surface and 6m depth. The general trend with time is a decrease in salinity was values falling from 34.5 and 34.0 09:00 (GMT), to 32.0 by 15:15 (GMT). In both figures 1 and 2 the change in water depth is due to the receding tide.
Fig 1.
Fig 3.
Current Flow
The speed of the flow past the current meter (Figure 3) did not vary much over the course of the day, with the slowest flow, 0.053 m/s, occurring at the surface at 14:45 and fastest, 2.97 m/s, at 1m at 12:15. There is an anomalous result of 0.770 m/s at 08:45 at 1m.
Secchi Disk
The depth of the water column decreases over the time series (Figure 4). The Secchi disk depth remains relatively constant throughout; however, there is an overall decrease in Secchi disk depth across the time series. An exception occurs at 10:45 where the Secchi disk depth increases from 2.5 to 3m.

Fig 1: Time series of temperature (°C), 28/06/2013 at King Harry’s pontoon
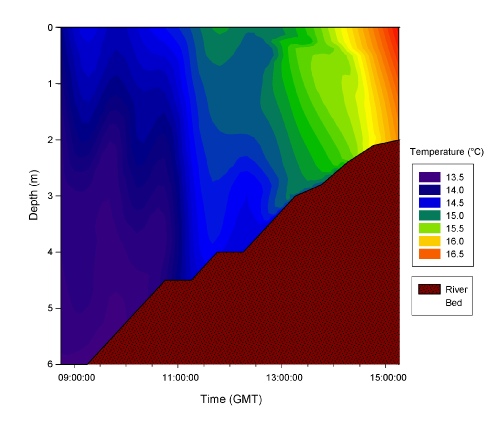
Fig 2: Time series of salinity, 28/06/2013 at King Harry’s pontoon
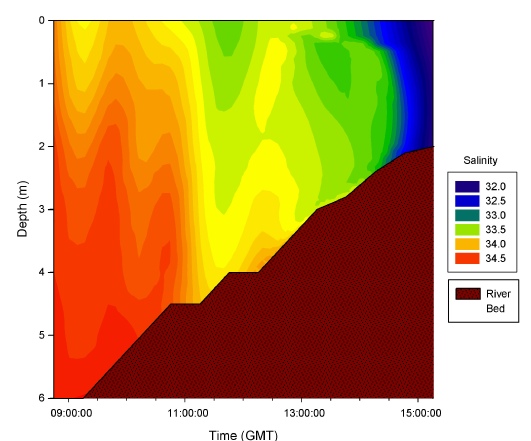
Fig 3: Flow speed (m/s) at surface and 1m depth
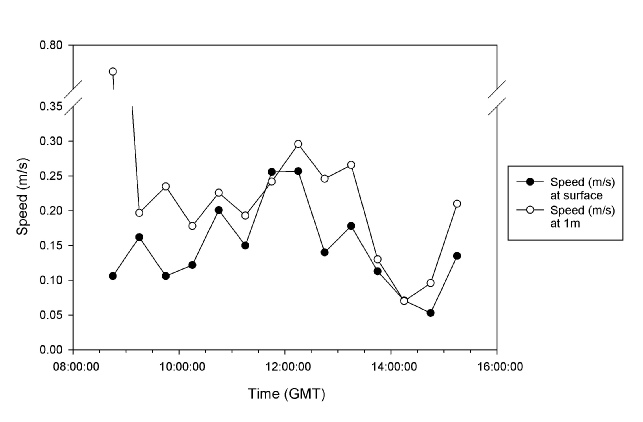
Fig 4.
Fig 2.
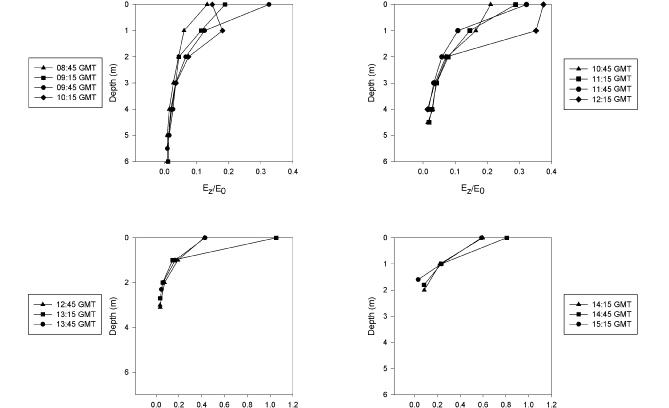
Light Attenuation
In the upper 2m of the water column there is the most variation in light attenuation over time. Below 2m the light attenuation levels remain relatively constant. The surface irradiance value at 10:15 GMT was lower than that at 1m. (Figure 5 a) Between 10:45 and 12:15 GMT a general increase was observed. (Figure 5 c) At 12:15 the Ez/E0 at 1m was greater than that at the surface.
In Figure 6 there is a clear shallowing of the 1% light level depth in accordance with the decrease of the water column depth.

Fig 4: Secci disk depth (m) and total water column depth (m)
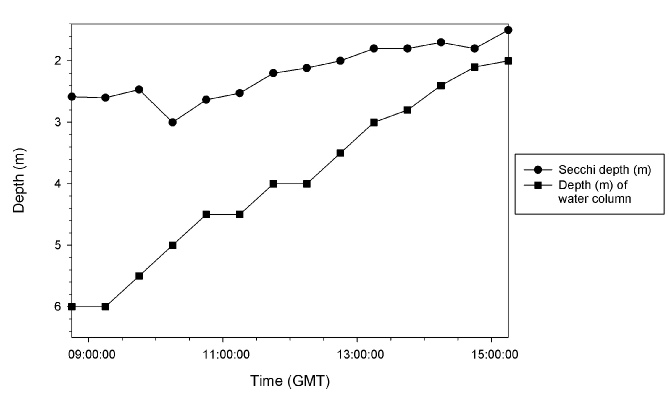
Fig 5a-
Fig 5a-
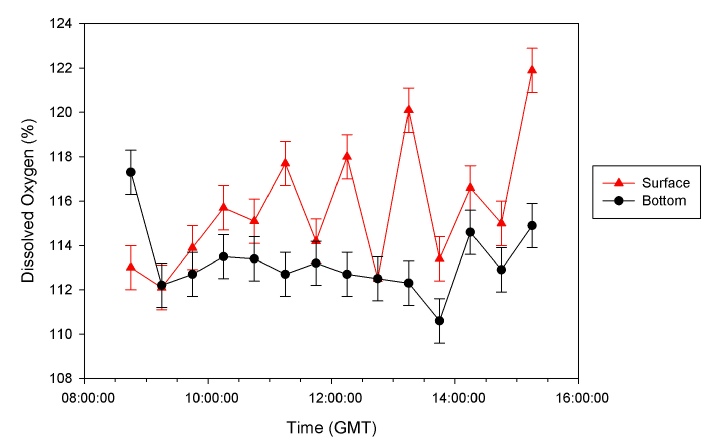
Dissolved Oxygen
Figure 7 shows that there is greater fluctuation in surface values of dissolved oxygen (DO) than along the river bed. Throughout the sampling period, the DO values at the river bed were lower than those at the surface. An exception is observed at 08:45 GMT where the bottom value is much higher than the surface value.
Fig 6.
Fig 7.
Fig 6: Depth of water column and 1% light level
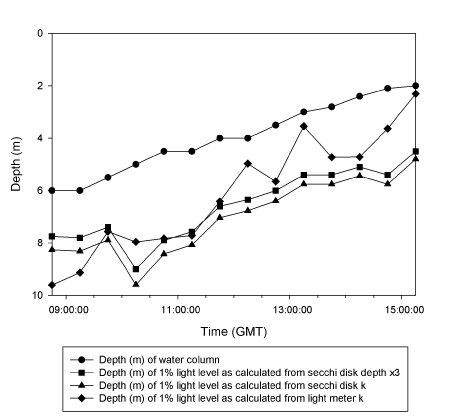

Fig 7: time series of dissolved oxygen (%) at surface and estuary bottom
Discussion
Limitations
The YSI Probe was placed straight into the water column from the surface. During descent the YSI probe would drift, potentially altering the data recorded at depth. The secchi disk was highly subjective, and similarly to the YSI probe the current caused it to drift. While measuring the current, the current reading would only update every 10 seconds. There was a chance the data could have been affected due to a boat docking at the pontoon during the 11.45GMT sampling. The Light Meter’s display changed very quickly and it was difficult to be consistently accurate in recording the data.
Temperature and Salinity
The increase in temperature evident over the time series is assumed to be a result of an increase in solar radiation until midday. The temperature in the water column also would continue to increase after midday.
The reason for the decreasing salinity over the time series is the tidal flushing of the higher salinity water out of the estuary, coinciding with the Low Tide at 15:20 (GMT).
The contour plot shown (Figure 1) includes interpolation, which is an example of
data falsification that can occur through the use of this specific graphical representation.
It can be observed at 3m depth between 12:00-
Current Flow
Data collection started just after high tide and continued to just before low tide;
therefore, it is expected that the highest flow speeds are around midday. The figure
also shows that the flow speed is higher at 1m than at the water-
Light
The light attenuation decreases exponentially with depth. The top 2m are important as this is where the majority of the initial downward irradiation is absorbed.
The surface reading, taken at 13:15 GMT is an outlier, possibly due to human error. (Figure 5c)
This figure shows less of an exponential decrease, owing to the decreasing water column depth and therefore the reduced number of data points available, as Low Tide on 28/06 was at 15:20 GMT. (Figure 5d)
Dissolved Oxygen
The greater fluctuation in surface values is due to the proximity to the water-
Conclusion
The changes in salinity and flow speed are a result of the ebbing tide. The temperature and light attenuation variation is due to increasing solar radiation and downward irradiance at the surface.
Fig 5a-
Fig 1.
Fig 1: Time series of temperature (°C), 28/06/2013 at King Harry’s pontoon

Fig 3: Flow speed (m/s) at surface and 1m depth

Fig 5a-

The views expressed on this website are those of the individuals and not necessarily the views of Southampton University or the National Oceanography Centre

