Introduction
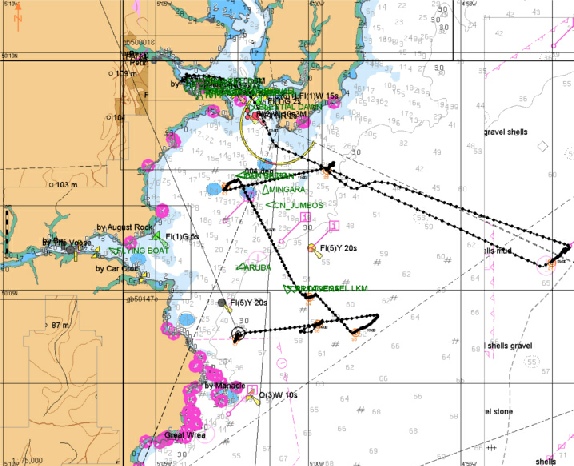
The aim of the offshore data collection was to determine the location, structure and length of the front. The objective was to take samples from specific sites that were identified to be in or on either side of the front.

Conditions
Date:
Time:
Latitude:
Longitude:
Wind Speed:
Wind Direction:
Cloud Cover:
Vessel:
Low water:
High water:
04/07/13
07:30-
50˚05’644N
004˚51’921W
12.40 (m/s)
152°
8/8
Callista
08:31 GMT
1.5m
14:39 GMT
4.30m
Station 1
Station 2
Station 3
Station 4
Station 5
Conditions
Date:
Time:
Latitude:
Longitude:
Wind Speed:
Wind Direction:
Cloud Cover:
Vessel:
Low water:
High water:
04/07/13
07:30-
50˚07’524N
004˚59’407W
15.6 (m/s)
323°
8/8
Callista
08:31 GMT
1.5m
14:39 GMT
4.30m
Conditions
Date:
Time:
Latitude:
Longitude:
Wind Speed:
Wind Direction:
Cloud Cover:
Vessel:
Low water:
High water:
04/07/13
07:30-
50˚07’114N
005˚02’777W
22.6 (m/s)
289°
7/8
Callista
08:31 GMT
1.5m
14:39 GMT
4.30m
Conditions
Date:
Time:
Latitude:
Longitude:
Wind Speed:
Wind Direction:
Cloud Cover:
Vessel:
Low water:
High water:
04/07/13
07:30-
50˚04’907N
005˚00’119W
11.70 (m/s)
32°
6/8
Callista
08:31 GMT
1.5m
14:39 GMT
4.30m
Conditions
Date:
Time:
Latitude:
Longitude:
Wind Speed:
Wind Direction:
Cloud Cover:
Vessel:
Low water:
High water:
04/07/13
07:30-
50˚04’121N
004˚58’469W
12.50 (m/s)
45°
3/8
Callista
08:31 GMT
1.5m
14:39 GMT
4.30m
Conditions
Date:
Time:
Latitude:
Longitude:
Wind Speed:
Wind Direction:
Cloud Cover:
Vessel:
Low water:
High water:
04/07/13
07:30-
50˚04’279N
004˚59’726W
10.80 (m/s)
197°
2/8
Callista
08:31 GMT
1.5m
14:39 GMT
4.30m
Conditions
Date:
Time:
Latitude:
Longitude:
Wind Speed:
Wind Direction:
Cloud Cover:
Vessel:
Low water:
High water:
04/07/13
07:30-
50˚03’930N
005˚02’406W
18.0 (m/s)
271°
2/8
Callista
08:31 GMT
1.5m
14:39 GMT
4.30m
Physical Data
CTD: results
For Stations 1 to 4 (Figures 1 to 4), the rapid increase in salinity, typically around 35.3, coincided with a chlorophyll maximum. The chlorophyll maximum also overlaps with the steepest temperature change at each station. A strong fall in temperature from the surface and between 15 and 25m was observed at all stations.
Stations 1 and 4 (Figure 1 and 4) had the greatest chlorophyll maximum, 3.8µg/l and 4.6µg/l, respectively. Following these maximums, both of these stations saw dramatic falls in chlorophyll to values around 1.4µg/l.
The chlorophyll maximum did not coincide with a rapid change in salinity at Station 5 (Figure 5). The temperature at this station increases gradually with depth as opposed to the other stations which exhibited sharp changes in temperature.
ADCP: results
At Station 1 (Figure 6a), there was a large band of strong backscatter at 16m measuring 75dB. There is also strong backscatter at the seabed in Stations 1, 2 and 4 (Figures 6a, 7a and 9a) and at the surface at Stations 1 to 3 (Figures 6a, 7a and 8a). The ship’s track suggests that currents in the area flow generally south west.
For all Stations bar 1, the ship’s track showed that the currents in the area generally flowed north. At Station 1 (Figure 6b), the current flow was in a south west direction.
CTD: discussion
The steep changes in temperature and salinity at each station, reflects the thermocline and halocline. The chlorophyll maximum at the thermocline and halocline which implies that the phytoplankton live along the boundary of the two water bodies [1]. When this occurs, it indicates the presence of a front. Stations 1 and 4 have profiles that reflect what would be observed at a front. It is assumed that Stations 2, 3 and 5 are located on the landward side of the front.
Station 5 is less stratified that the other stations. This means that nutrients are more likely to occur throughout the water column and as such, phytoplankton will utilise them. The lack of nutrient data means this cannot be confirmed.
ADCP: discussion
The strong backscatter band near the surface at all of the stations represents zooplankton.
There was also some backscatter near the seabed, most likely from re-
At Station 2, the zooplankton band is less well defined due to the relative shallowness
of the water column. At Station 3 the zooplankton band was of a greater intensity
suggesting greater abundances. Station 4 showed a more diffuse zooplankton layer
at approximately 17m. The discrete area of re-
The zooplankton layer was less well defined at Station 5 than at other stations,
suggesting a low abundance. There was little surface entrainment or re-
Conclusion
Two of the stations observed trends associated with a front. There was generally strong backscatter observed at all stations due to zooplankton blooms.
Chemical Data
Richardson number
For Station 1 (Figure 10), the Richardson number was determined by using CTD and
ADCP data. The following equation (gx(ρ1-
Nutrients
The nutrient minimum at Station 4 (Figure 11) correspond to a chlorophyll maximum at the same depth (Figure 4). We can therefore consider that the depletion of silicon is, at least, in part due to the uptake by diatoms.
The general trend of phosphate (PO43-
Due to a combination of sparse sampling and analytical issues, the data from nitrate
(NO3-
Oxygen Saturation
The observed trend at the surface is due to the close proximity to the Water-
Conclusion
The nutrient concentrations are lower at the surface due to the utilisation by phytoplankton and the oxygen saturation is highest at the surface because of interaction with the air.
Biological Data
Phytoplankton
Diatoms were the dominant group in 4 of 6 samples. No diatoms were found in samples at 1.48m at Station 1 (Figure 14) or 34.11m Station 5 (Figure 14). The greatest abundance of phytoplankton was found at the surface of Station 5, while the lowest abundance was found at 34m at Station 5 (Figure 14).
Zooplankton
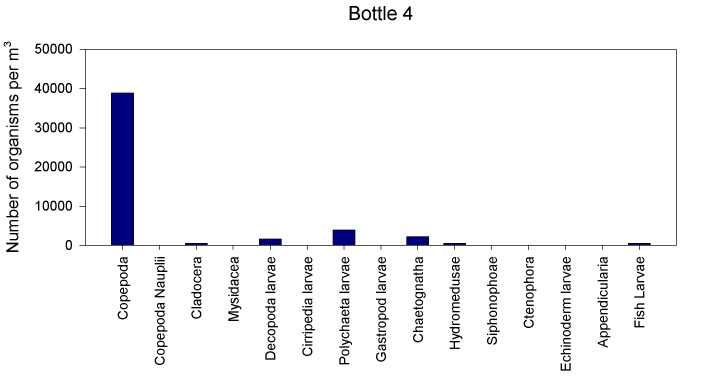
Among the zooplankton, Copepods were the dominant group in 6/7 of the samples. A large number of Hydromedusae were found were Copepods were not dominant. The other zooplankton groups were found in more variable abundances. The greatest number of zooplankton were found in samples 3 and 4, from Stations 2 and 3 (Figures 16 and 17) respectively, while the lowest abundance of zooplankton was found in sample 1 from Station 1 (Figure 15).
Discussion
The low abundances of both phytoplankton and zooplankton found at Station 1 may be a result of the highly stratified water column limiting growth to deeper waters. The high abundances of plankton at the surface of Station 5 may be due to increased mixing between layers of the water column. The high abundance of hydromedusae at Station 4 may have been due to sampling error during the counting and identification stage, or a localised patch of the zooplankton.
Conclusion
Station 5 had the highest diatom values of all stations at the surface. Copepods were the most dominant zooplankton observed at the majority of stations.
References
[1] Fernàndez, E., Cabal, J., Acuna, J.L., Bode, A,. Botas, A. and García-
Fig 1
Fig 2
Fig 5
Fig 4
Fig 3
Fig 6a
Fig 7a
Fig 8a
Fig 9a
Fig 6b

Fig 7a: ADCP profile showing Average backscatter for Station 2
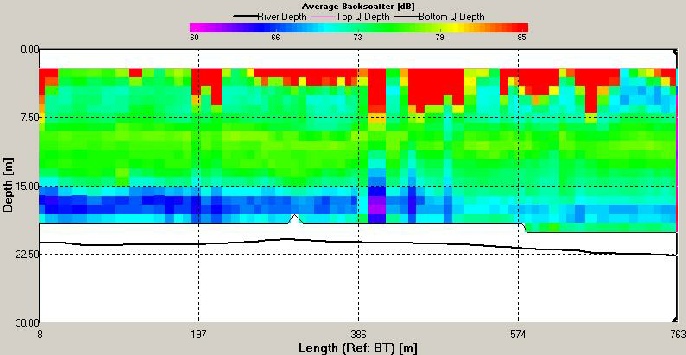
Fig 6a: ADCP profile showing Average Backscatter at Station 1
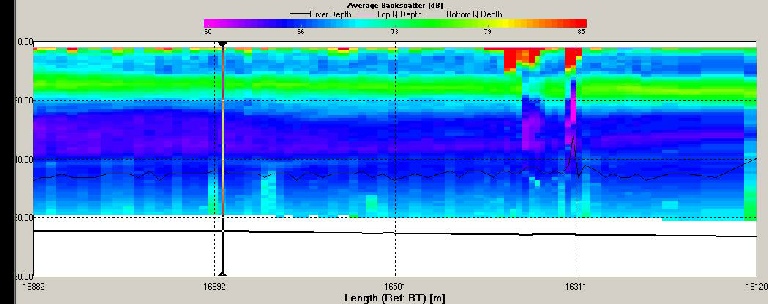
Fig 1: CTD data for temp, chlorophyll, salinity and PAR for Station 1
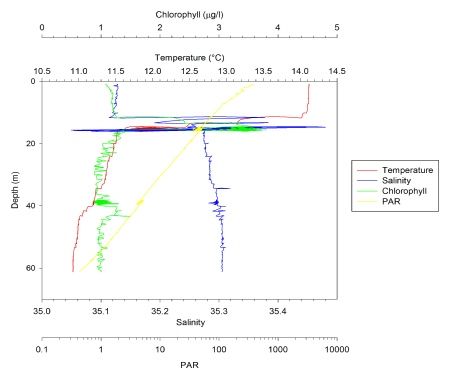
Fig 5: CTD data for temp, chlorophyll, salinity and PAR for Station 5
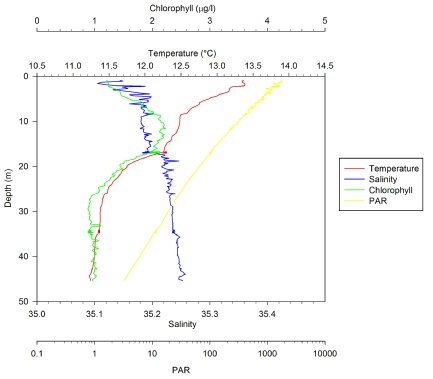
Fig 6b: Ship’s track showing current vectors across Station 1
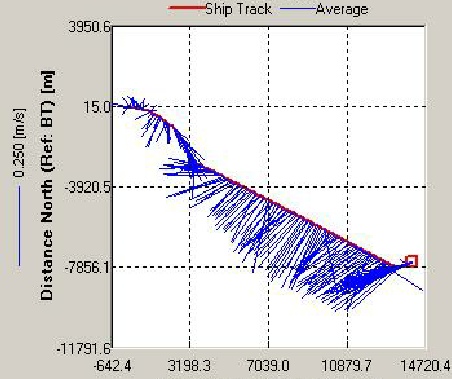
Fig 8a: ADCP profile, showing Average Backscatter for station 3
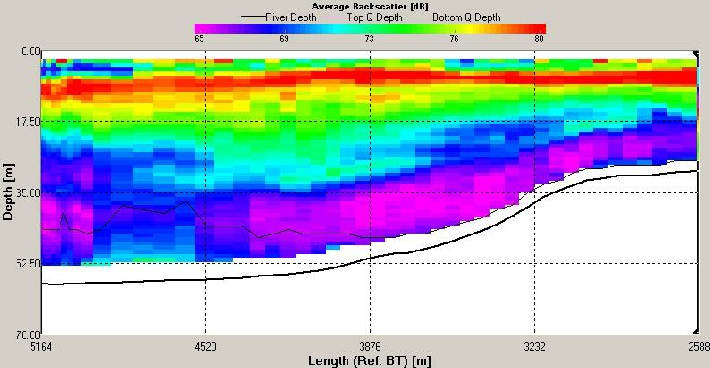
Fig 4: CTD data for temp, chlorophyll, salinity and PAR for Station 4
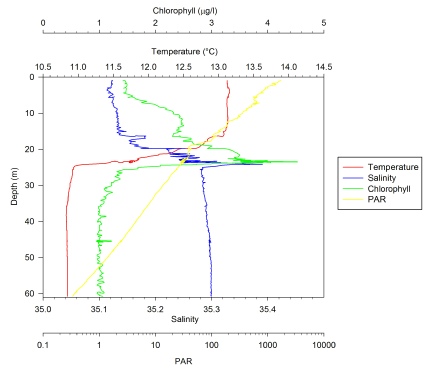
Fig 3: CTD data for temp, chlorophyll, salinity and PAR for Station 3
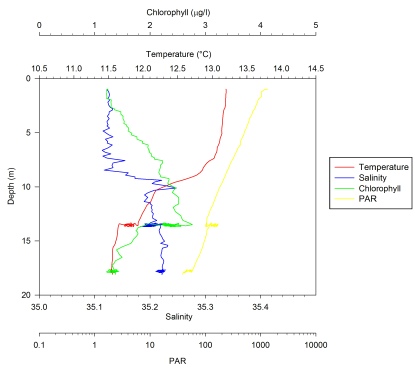
Fig 2: CTD data for temp, chlorophyll, salinity and PAR for Station 2
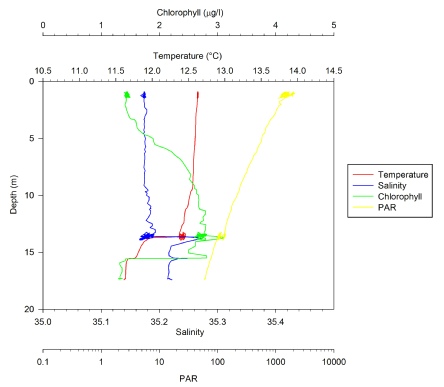
Fig 9a: ADCP profile, showing Average Backscatter, for station 4
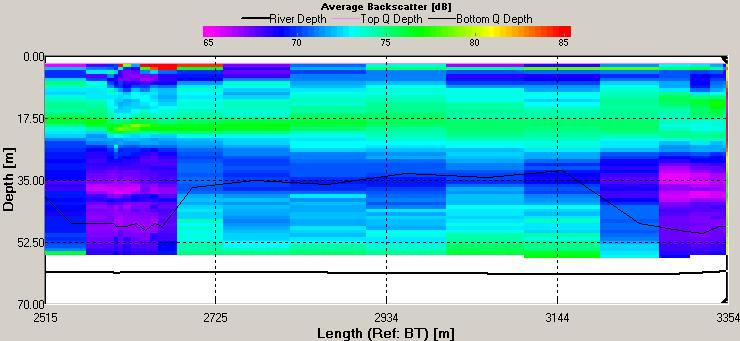
Fig 10

Fig 10: Richardson number depth profile for Station 1
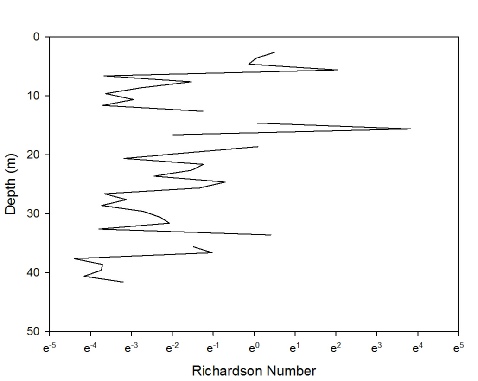
Fig 11
Fig 12

Fig 11: Silicon concentration depth profiles for Stations 1-
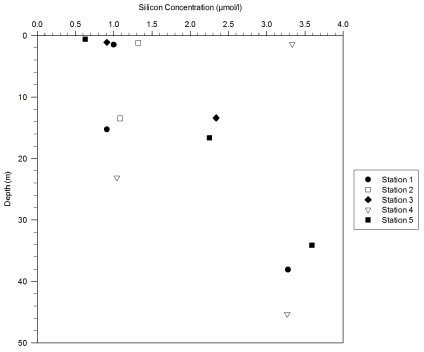
Fig 12: Phosphate concentration depth profiles for Stations 1-
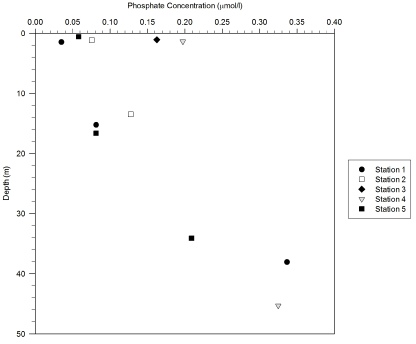
Fig 14
Fig 15
Fig 17
Fig 16

Fig 14: Phytoplankton abundance for Stations 1 & 5
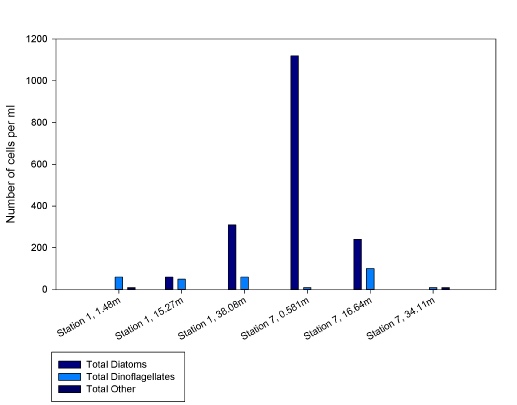
Fig 15: Zooplankton abundance for Station 1, depth 30-
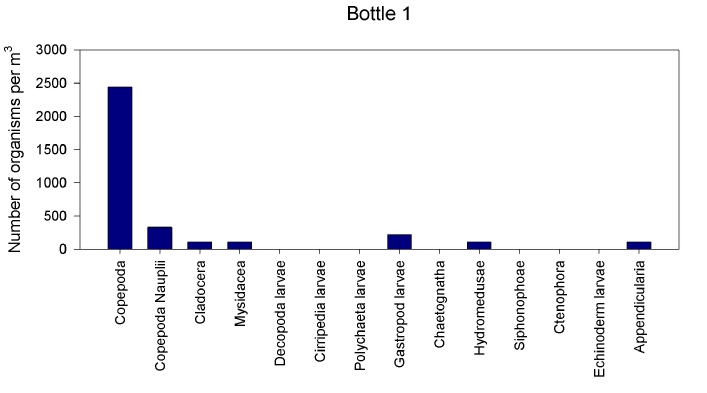
Fig 16: Zooplankton abundance for Station 2, depth 15-
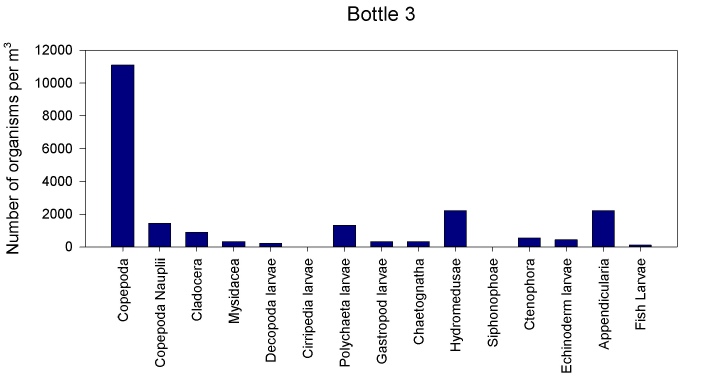
Fig 17: Zooplankton abundunce for Station 3, depth 15-

The views expressed on this website are those of the individuals and not necessarily the views of Southampton University or the National Oceanography Centre

