Mixing Diagrams: results
Figure 13 shows that the data points lie above the Theoretical Dilution Line (TDL)
towards the seawater end-
Chlorophyll, Nitrate and Phosphate: results
Generally, higher chlorophyll concentrations were observed within the upper estuary
(4.2 μg/L), compared to the lower (2.1 μg/L). The concentrations of chlorophyll at
most stations were generally greater nearer the surface. Both nitrate and phosphate
(NO3 and PO43-
Introduction
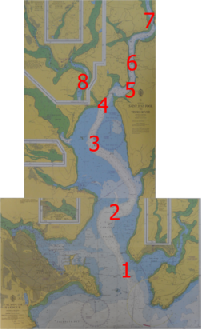
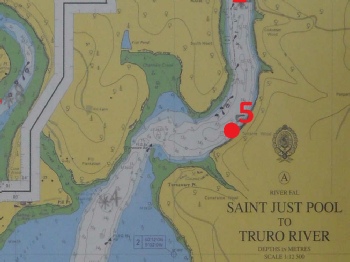
The aim of the estuarine data collection was to observe the interaction between freshwater and saltwater and how this affects the physics, chemistry and biology in the Fal estuary. The objective was to take samples at specific stations and depths up the length of the estuary and compile the data with that collected by the other SOES students over the two week investigation. This would provide a greater picture of the estuarine environment. Estuaries are important to study as they are complex environments that have a range of physical, chemical and biological factors.
Physical Data

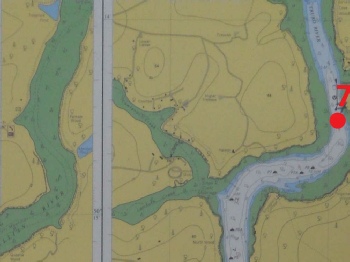
Station 7
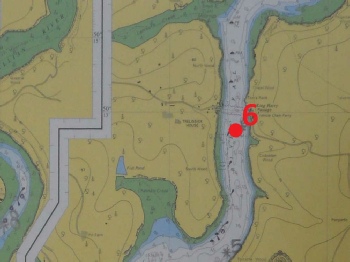
Station 6
Station 5
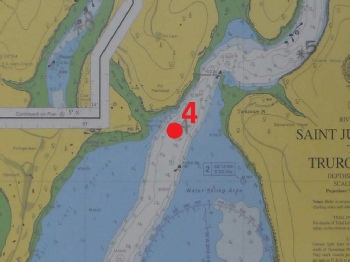
Station 4
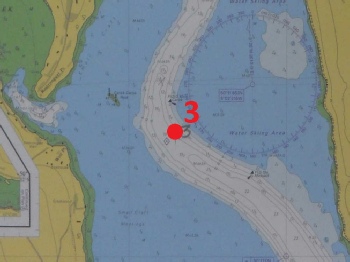
Station 3
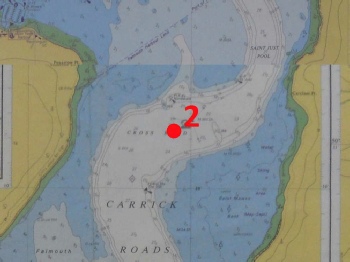
Station 2
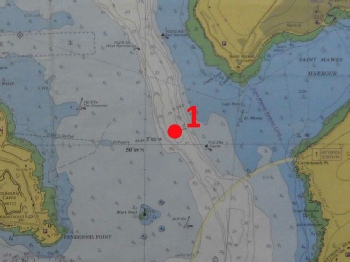
Station 1
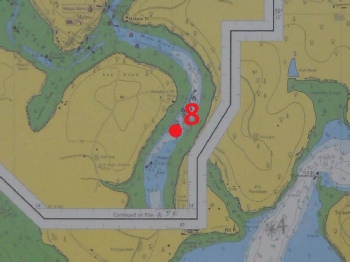
Station 8
Conditions
Date:
Time:
Latitude:
Longitude:
Wind Speed:
Estuary State:
Cloud Cover:
Vessel:
High water:
Low water:
High water:
29/06/13
10:00 GMT
50˚12’201N
005˚02’432W
Missing (group 1)
Missing (group 1)
Missing (group 1)
Missing (group 1)
03:40 GMT
4.6m
16:00 GMT
0.9m
21:00 GMT
4.7m
Conditions
Date:
Time:
Latitude:
Longitude:
Wind Speed:
Estuary State:
Cloud Cover:
Vessel:
High water:
Low water:
High water:
29/06/13
13:17 GMT
50˚13’637N
005˚00’938W
Slight Breeze
Calm
8/8
Conway
03:40 GMT
4.6m
16:00 GMT
0.9m
21:00 GMT
4.7m
Conditions
Date:
Time:
Latitude:
Longitude:
Wind Speed:
Estuary State:
Cloud Cover:
Vessel:
High water:
Low water:
High water:
29/06/13
09:26 GMT
50˚11’451N
005˚02’704W
Missing (group 1)
Missing (group 1)
Missing (group 1)
Missing (group 1)
03:40 GMT
4.6m
16:00 GMT
0.9m
21:00 GMT
4.7m
Conditions
Date:
Time:
Latitude:
Longitude:
Wind Speed:
Estuary State:
Cloud Cover:
Vessel:
High water:
Low water:
High water:
29/06/13
08:45 GMT
50˚10’242N
005˚02’116W
Missing (group 1)
Missing (group 1)
Missing (group 1)
Missing (group 1)
03:40 GMT
4.6m
16:00 GMT
0.9m
21:00 GMT
4.7m
Conditions
Date:
Time:
Latitude:
Longitude:
Wind Speed:
Estuary State:
Cloud Cover:
Vessel:
High water:
Low water:
High water:
29/06/13
07:49 GMT
50˚09’051N
005˚01’862W
Missing (group 1)
Missing (group 1)
Missing (group 1)
Missing (group 1)
03:40 GMT
4.6m
16:00 GMT
0.9m
21:00 GMT
4.7m
Conditions
Date:
Time:
Latitude:
Longitude:
Wind Speed:
Estuary State:
Cloud Cover:
Vessel:
High water:
Low water:
High water:
29/06/13
12:53 GMT
50˚12’950N
005˚01’590W
Slight Breeze
Calm
6/8
Conway
03:40 GMT
4.6m
16:00 GMT
0.9m
21:00 GMT
4.7m
Conditions
Date:
Time:
Latitude:
Longitude:
Wind Speed:
Estuary State:
Cloud Cover:
Vessel:
High water:
Low water:
High water:
29/06/13
13:41 GMT
50˚14’303N
005˚00’980W
Slight Breeze
Calm
8/8
Conway
03:40 GMT
4.6m
16:00 GMT
0.9m
21:00 GMT
4.7m
Conditions
Date:
Time:
Latitude:
Longitude:
Wind Speed:
Estuary State:
Cloud Cover:
Vessel:
High water:
Low water:
High water:
29/06/13
12:06 GMT
50˚12’950N
005˚01’590W
Slight Breeze
Calm
6/8
Conway
03:40 GMT
4.6m
16:00 GMT
0.9m
21:00 GMT
4.7m
Chemical Data
CTD: results
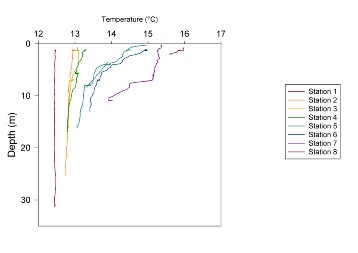
The profiles across the estuary, in Figure 1, show that the temperature at the mouth (12.4°C) is constant with depth and at the upper estuary (16.0°C), was more stratified, particularly at Station 5. There was a large jump in surface temperature from Stations 4 to 5.
Figure 2 shows that salinity, at Station 1, is constant throughout the water column at 35.8. Up the estuary, salinity decreases and the water column becomes stratified. There is only a very small change in salinity throughout the estuary; from 35.8 to 32.9.
The transmission data, in Figure 4, decreased up the estuary. Stations 1 to 4 (transmission around 4.2v) have constant transmission throughout the water column whereas Stations 5 to 7 have a slight increase in transmission with depth.
Fig 1.
Fig 2.
Fig 4.

Fig 4: Transmission depth profiles for stations 1-
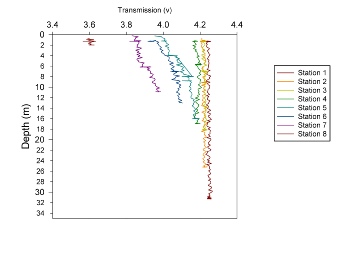

Fig 2: Salinity depth profiles for stations 1-
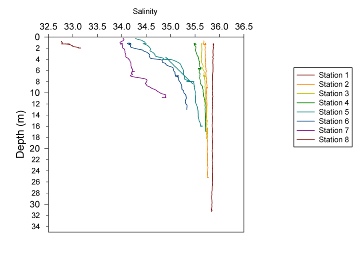
Fig 1: Temperature depth profiles for stations 1-
CTD: discussion
A time lag in data collection between Stations 4 and 5 may be the cause of the sudden rise in surface temperature at Station 5. The almost constant temperature throughout the water column at the first four stations may be due to the Fal estuary being well mixed.
The minor changes in salinity across the length of the estuary would suggest that the Fal Estuary is well mixed and thus, tidally dominated. Data was sampled as the tide was moving out. This meant that fresh river water could be measured as it flowed downstream.
The transmission is lower at the mouth and, therefore, the water is less turbid.
ADCP: discussion
The areas of increased backscatter observed at Station 6 may be the result of an object in the water column obstructing flow.
Station 4 data was obtained just after high tide; therefore, the little directional flow was due to the turning tide. The changes in direction of flow throughout the estuary are also a result of the turning tide.
ADCP: results
The left side of the estuary at Station 1 had a southward flow (Figure 5a). Figure 5b, shows average velocity is generally constant, at about 0.275m/s, at this station. At Station 2 (Figure 6a) the left side of the estuary had a faster northward flow of 0.25m/s and a southward flow of 0.125m/s on the right.
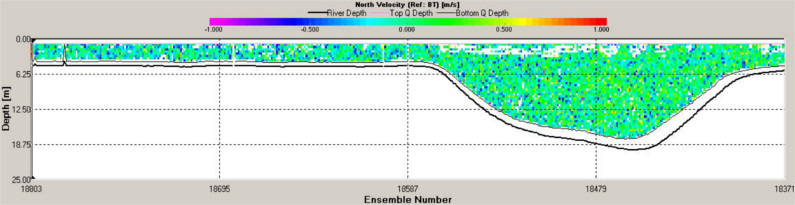
Figure 7a shows that at Station 4, there was little directional flow. This was confirmed in Figure 7d which showed equal northward and southward across the ship’s track.
During the sampling of Stations 5 to 8, the tide was moving out, resulting in a net flow towards the mouth (southwards), unlike Stations 1 to 4 where water was moving into the estuary (northwards).
A visible difference can be seen between the freshwater and the saltwater bodies in Figures 9a and b at Station 6. Station 6 had two points of increased backscatter within areas of low backscatter (at 100dB) (Figure 9c).
Fig 5a.
Fig 5b.
Fig 6a.
Fig 7a.
Fig 7d.
Fig 9a.
Fig 9b.
Fig 9c.
Conclusion
The general trends noted were that the mouth of the estuary was well mixed and higher up the estuary the water column was more stratified. The tide changed during data collection which may have been the cause of some of the changes observed in the data.
Dissolved Silicon: results
The Si concentration remained relatively constant down the water column for the first four stations (Figure 12). The concentration of dissolved silicon, for Stations 1 to 4, was roughly 2 µmol/L. The surface concentrations of dissolved silicon increased from Stations 1 to 8 from 1.5 to 8.6 µmol/L, respectively. Stations 5 to 7 showed a decrease in concentration with depth.
Fig 11.
Fig 12.
Fig 13.
Percentage Oxygen Saturation: discussion
Only two POS samples were taken at most stations. This means that it is not possible to assess the processes occurring in the water column. For Stations 4 and 6 only one sample was collected and so, cannot be used to analyse the vertical profile.
Fig 14.
Mixing Diagrams: discussion
There is insufficient data, between the two end-
Chlorophyll, Nitrate and Phosphate: discussion
Greater chlorophyll concentrations at the surface are most likely due to the stimulation
of photosynthesis by light. Decreases in the nutrient data suggests that the phytoplankton
growth results in the consumption of NO3 and PO43-
An outlier was removed from Figure 14 at Station 5 as it was a repeated measurement and showed a much lower chlorophyll value than a point at the same depth.
For all stations, too few depths were sampled to obtain a detailed image of nutrient and Chlorophyll concentrations. Stations 1 and 8 only sampled at the surface and the bottom; this means it is impossible to assess processes in the water column.
Biological Data
Phyto and Zooplankton: results
Diatoms were the dominant phytoplankton group in all the collected samples (Figure
17). There were greater numbers of phytoplankton present in samples taken in the
lower estuary (570-
Phyto & Zooplankton: discussion
The areas of high abundance of phytoplankton at the sample stations coincided with areas of low nutrient concentrations as phytoplankton uptake nutrients to facilitate growth. Similarly, high nutrient concentrations reflected low phytoplankton abundance. Based on Stations 1 and 3, zooplankton abundance is greater in areas of high phytoplankton abundance as many zooplankton graze phytoplankton.
Conclusion
Overall, the abundance and diversity of phytoplankton and zooplankton decrease with increasing distance up the estuary. This is because they thrive in marine waters and higher up the estuary, the water becomes more saline and fewer phytoplankton and zooplankton can survive.
Fig 15.
Fig 16.
Conclusion
A lack of data meant it was difficult to discuss how any of the nutrients behaved
up the estuary in a mixing diagram. This meant that it could not be determined if
the nutrients were conservative or non-
Fig 12.
Fig 17.

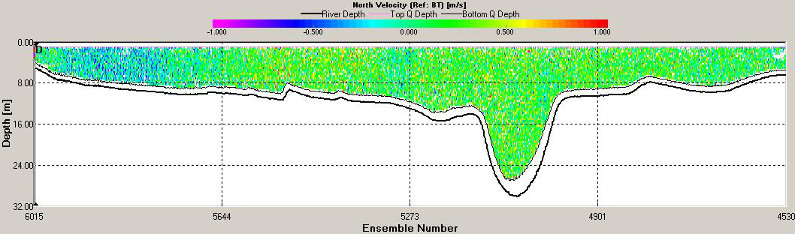
Fig 5a: ADCP profile, showing North velocity, for station 1
Fig 5b: ADCP profile, showing Earth velocity Magnitude, for station 1
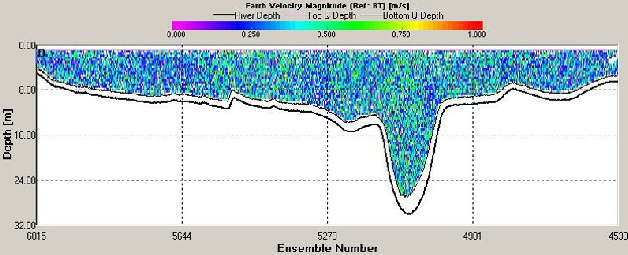
Fig 6a: ADCP profile, showing North velocity, for station 2
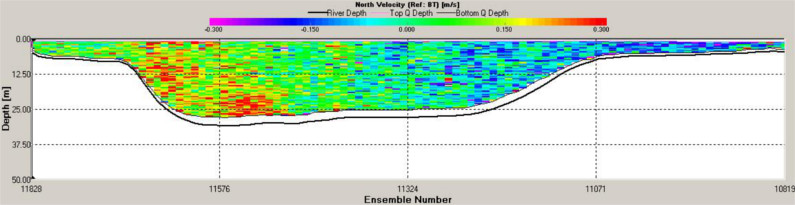
Fig 7d: Transect showing current vector for station 4
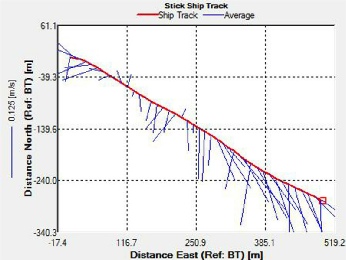
Fig 9c: ADCP profile, showing Average backscatter, for station 6
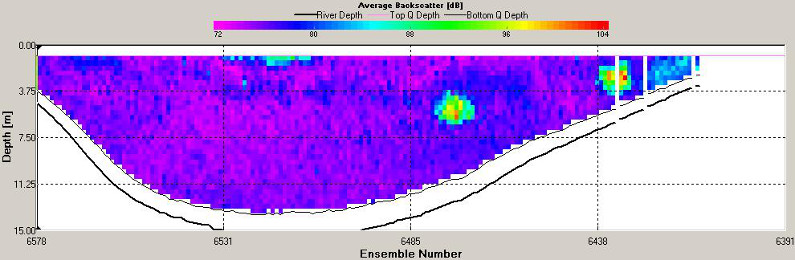
Fig 8b: ADCP profile, showing Earth velocity Magnitude, for station 5
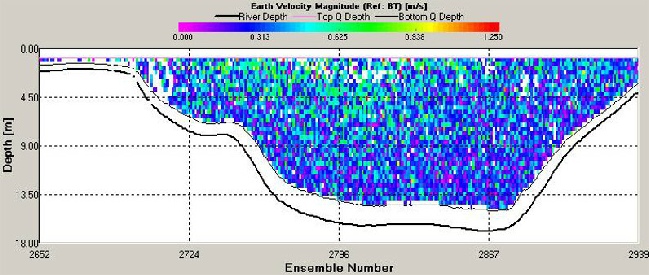

Fig 8a: ADCP profile, showing North velocity, for station 5
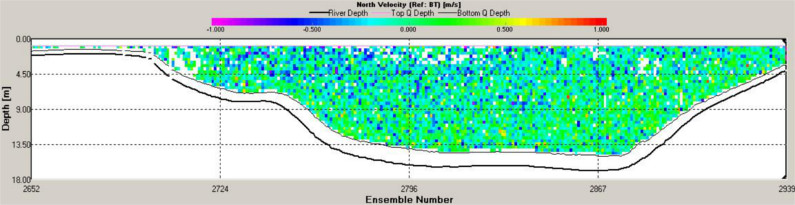
Fig 7a: ADCP profile, showing North velocity, for station 4
Dissolved Silicon: discussion
Riverine inputs are the main source of dissolved silicon into marine systems (Struyf et al. 2009). As the estuary widens towards the mouth, the freshwater is diluted into sea water, which has low concentrations of silicon, and therefore silicon concentration decrease.
Stations 1 to 4 have lower dissolved silicon concentrations but a higher diatom abundance compared to Stations 5 to 8. This is because diatoms take up silicon to produce silica frustules (Vrieling et al. 1999; Struyf et al. 2009).
The Fal Estuary is tidally dominated and seawater reaches far up the estuary. As a result, this led to insufficient data being collected at salinities below 31 and, therefore, cannot conclude the behaviour of dissolved silicon in the estuary.

Fig 12: Silicon concentration depth profiles for stations 1-
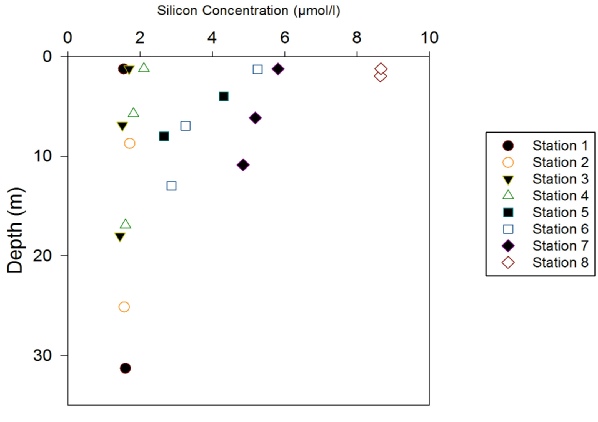
Fig 17: Plankton numbers per m2 for stations 8, 7, 5, 4, 3 & 1
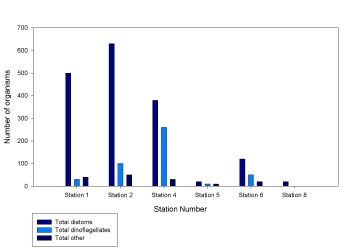
Fig 14.
Zooplankton: results
Copepods dominated the zooplankton in all samples, as either adults or nauplii. Polychaete larvae were also present in high abundance at Stations 1 and 8. Other zooplankton groups, such as fish larvae, chaetognaths and mysids, occurred in more variable numbers. The greatest abundance of zooplankton (5607.69 individuals per m3) occurred at Station 1(Figure 18a) and the lowest at Station 2 (0.07 individuals per m3) (Figure 18b).
Fig 17.

Fig 17: Plankton numbers per m2 for stations 8, 7, 5, 4, 3 & 1
Fig 18a: Zooplankton abundance per m2 at station 1
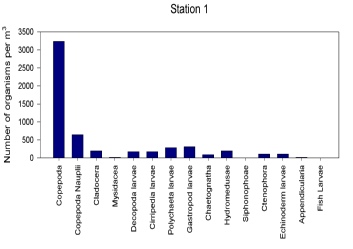
Fig 18b: Zooplankton abundance per m2 at station 2
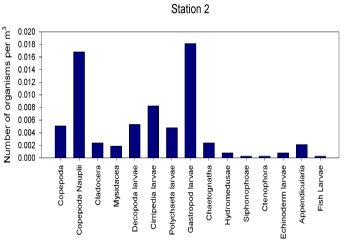
Fig 18a.
Fig 18b.
Percent Oxygen Saturation: results
The general trend in Figure 11 is an increase in surface POS up the estuary. Each stations shows a unique vertical profile.

Fig 11: Percent Oxygen saturation depth profiles for stations 1-
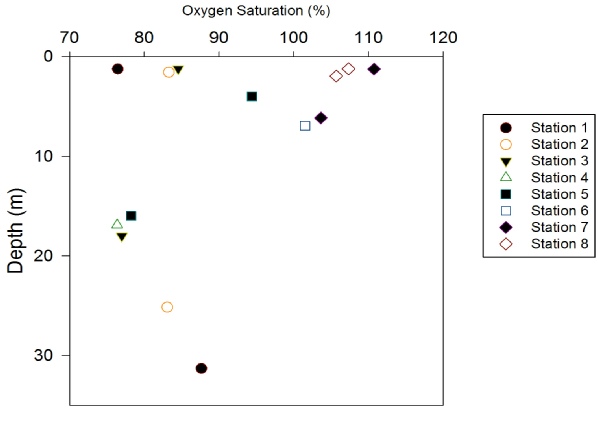
Fig 12: Silicon concentration depth profiles for stations 1-
Fig 13: Mixing diagram for phosphate with both end members
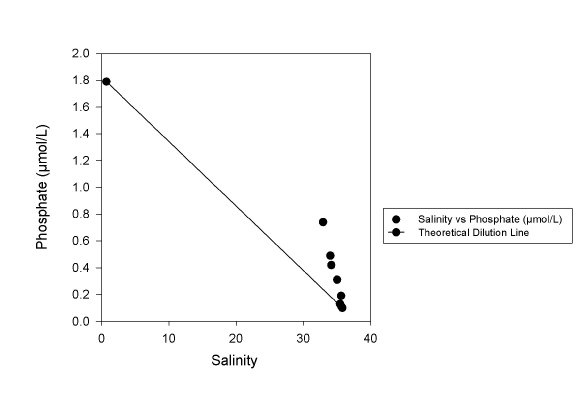

Fig 14: Chlorophyll concentration depth profiles for stations 1-
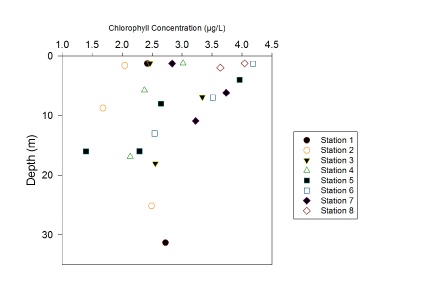
Fig 15: Nitrate concentration depth profiles for stations 1-
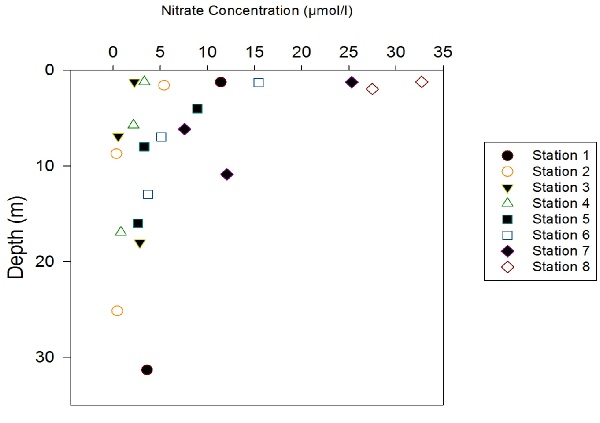

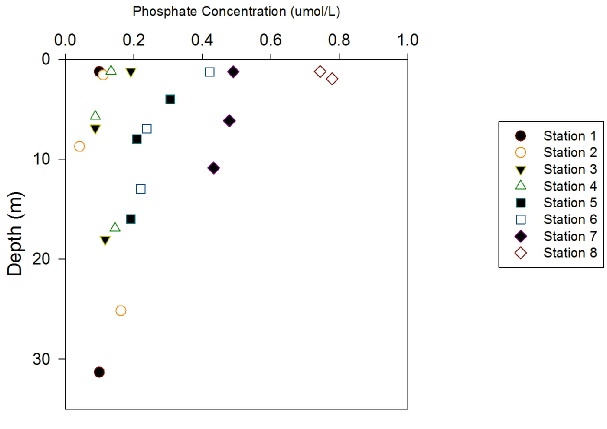
Fig 16: Phosphate concentration profiles for stations 1-
References
MBA. 2003. Occasional Publication No.8. The Fal and Helford. Special area of conservation. Report to environment agency and English Nature.
Struyf E., Smis A., Van Damme S., Meire P., Conley D. J. 2009. The Global Biogeochemical
Silicon Cycle. Silicon. 1, 207-
Vrieling E. G., Beelen T. P. M., Santen R. A., Gieskes W. W. C. 1999. Diatom Silicon
Biomineralization as an Inspirational Source of New Approaches to Silica Production.
Journal of Biotechnology. 70, 39-

Fig 14: Chlorophyll concentration depth profiles for stations 1-

The views expressed on this website are those of the individuals and not necessarily the views of Southampton University or the National Oceanography Centre

