
Grey Bear - Geophysics and Bathymetric Surveying of Falmouth Bay
| Return to Home Page | Bill Conway - Estuarine Analysis | Callista - Offshore Analysis | Ribs - Estuarine Analysis |
|
AIM:
To determine the positions of three known wrecks in Falmouth Bay and analyse the biological and geological composition of the seafloor.
OBJECTIVE:
The main objective of the survey was to find the exact location of the three shipwrecks located on the chart. Using side-scan sonar their positions were located and information was gathered to determine the structure and shape of the three wrecks. We were also looking out for any patterns, such as ripples in the seabed and any clearly separate sections of seafloor, between rock and sediment.
METHODS:
Side-scan sonar was used along five transects which ran North to South (Figure 6). The parallel tracks were close enough to allow overlapping of the side-scan, around 100m apart. Each track ran for approximately 1600m. The group was split in two, with half the personnel watching the side-scan read-out for any obvious changes in sediment type and the wreck sites, and the rest helping the skipper maintain a correct position along the transects, whilst recording GPS data.
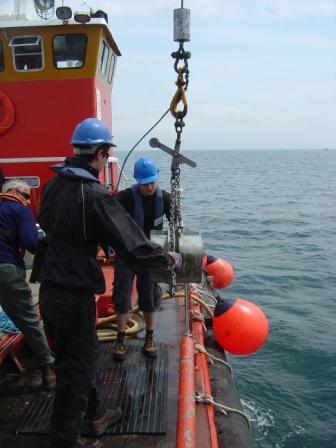
A Van Veen grab (Figure 2) was used in four separate locations to determine the composition of the seafloor. The positions of the grabs were ascertained from the read out of the side-scan. Any notable changes in backscatter, reflection or shadow on the side-scan were flagged to determine what the changes on the display were showing on the seafloor. Once taken, an identification of the contents of the grab was carried out, noting specific species and their abundance.
1
 2
2
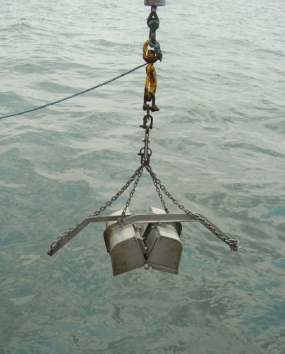
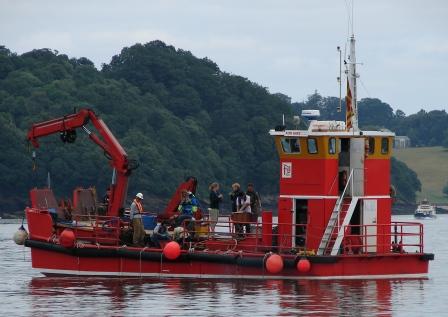
Figure 1 - Group 12 deploying the Van Veen Grab
Figure 2 - 'Van Veen' Grab at the surface before sediment capture (open)
RESULTS:
WRECKS - The two wrecks that were investigated were located on the third, fourth and fifth transects of the survey site. Both wreck sites were around 4000m2 in size although the second wreck, found North of the first, was slightly smaller. Further information gathered on the day revealed the wrecks had since been destroyed by local fishermen, which resulted in indefinable debris sites on the seafloor. Using the information collected by the side-scan sonar, the highest recorded emergence of a wreck was calculated at 0.77m, with a face of 3.4m.
3
 4
4
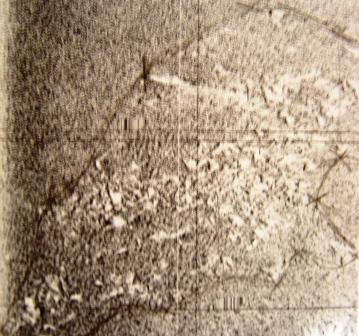
Figure 3 - Ripples on the seabed collected during a transect on the Grey Bear, 6th July 2006
Figure 4 - Side-scan sonar image of one of the wrecks in Falmouth Bay, 6th July 2006
SEAFLOOR COMPOSITION - There were two different types of rock observed in the area surveyed; bedrock comprised of slate and sand sized estuarine sediments that covered the bedrock. The grab sites chosen confirmed the side-scan sonar observation. However, due to the limited number of grabs this cannot be confirmed for the entire Falmouth Bay area. It is therefore assumed that these areas contained sand grain-sized sediments, as back scatter was relatively weak in comparison to the bedrock. The sediments showed clear structures in the form of mega ripples, which predominantly showed straight crests and occasional good examples of bifurcation. The general trend in mega ripple orientation was North-East to South-West and the strike of the bedrock shows a trend with the known on shore strike.
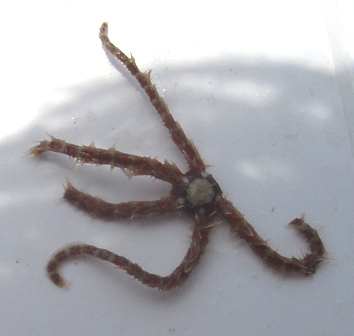
BIOLOGY - Maerl (calcareous seaweed) was found in every grab, although the proportion found compared to the volume of bedrock sediment varied between each site. Other than Maerl, the general biological composition of the grabs was low, with few individuals identified. Several Brittle Stars (Figure 4) were found as well as Chitons attached to the substrate. The grab sites tended to be over 20 metres deep, with enough light penetration to allow various species of red and brown algae to grow. One small crab (~2cm carapace length) and a juvenile rag worm were also found. The composition of each of the four grab sites can be found in the tables below.
![]()
![]() 5
5
 6
6


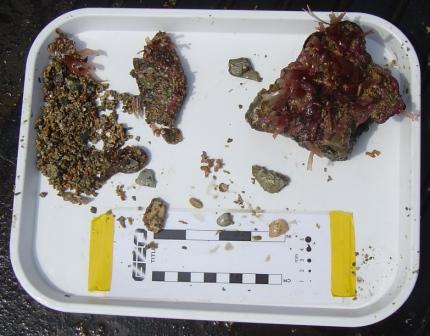
![]() Figure 5 - 'Van Veen' grab sediment sample
Figure 5 - 'Van Veen' grab sediment sample
Figure 6 - Brittle Star found in sediment grab 2
|
|
|
|
DISCUSSION:
WRECKS - It is believed that an oil tanker sank in the Falmouth Bay during the 1940's and local authorities decided to blow up the wreck to avoid a major environmental catastrophe later. During this process, a tug ship was accidentally sank as well adding to the seabed wreck. There were two wreck sites described on the map, although it was not known which site was which vessel, or whether further ships had sunk in the same location.
A rough estimation of the area of the two wreck sites scanned was determined by use of Pythagoras theorem calculating the elliptical area, as well as the use of simple trigonometric functions to create an idea of the face of the wreck. The height of the wreck and debris in contact with the seafloor can be analyzed by measuring ranges and shadow length and applying the previously mentioned calculations. Wreck 1 was the largest and most prominent debris field recorded and was calculated to be 0.7m high with a face of 3.4m. Using the elliptical area equation the estimated site area was measured at 3,901m2. The debris was concentrated in a more linear form, whereas in wreck 2 the debris was widely distributed across the area. There was no relief clear enough to make a significant calculation at wreck 2, therefore no measurements for face and height were recorded. The site area of wreck 2 was calculated to be 4000m2. The scour marks, possibly produced by fishing trawls, observed at wreck 2 were perpendicular to the length of wreck debris field. The two most prominent scour marks were measured; the minimum estimated depth was between 0.2m and 0.3m. This is a reasonable prediction considering the fragmentation and disruption of the debris within the site area. Also, there is evidence of a certain degree of flow direction across the south west region of the site, which is another possible explanation of the scour marks.
SEAFLOOR - Predominantly coarse sediment, with clear boundaries between areas of bedrock and sediment, was found as shown on the transect map (Figure 5) of our geophysics poster. The sediments showed clear structures in the form of mega ripples, which predominantly showed straight crests and occasional good examples of bifurcation. The general trend in mega ripple orientation was North-East to South-West, indicating a current flow in this direction. The strike of the bedrock shows a trend in direction with the known onshore strike, possibly confirming conformity of local geology. This helps to confirm our measurements and backs up the suggestion that there are no significant changes in offshore geology when compared to the onshore geology.
BIOLOGY - The Maerl is mentioned by JNCC guidelines for selection of intertidal SSSI’s (Site of Special Scientific Interest) (SACS, 2005). The results show that the Maerl beds extend further out from the estuary than was previously thought, allowing the improvement of the database concerned with protecting this type of seaweed in the British Isles. The information can be used to predict spatial and temporal movements of the species, although further investigation is required before firm conclusions can be suggested. The fact that considerable levels of Maerl were found out into the Falmouth Bay suggests that guidelines regarding commercial use of the area may need revising as the species is protected. An official SOES dive on 10th July 2006 at the mouth of the Fal River which enters the Falmouth Bay revealed that the seabed is considerably covered by Maerl, providing increased habitats for other species due to it's increased surface area.
Other than Maerl, the biology found in the sediment grabs was limited in numbers and mainly small juvenile individuals. Estuarine waters tend to be areas of reduced water flow which allows nursery grounds to form as offspring are more protected. Very few motile species were observed, with only a handful of brittle stars and a single small crab recorded. Bryozoa was encrusted on much of the larger rock material along with red and brown macroalgae. No grab samples were taken in the immediate vicinity of the wrecks due to risk of anchorage of the debris, which would have been useful as it might be expected that an increased level of local biology would be observed.
7 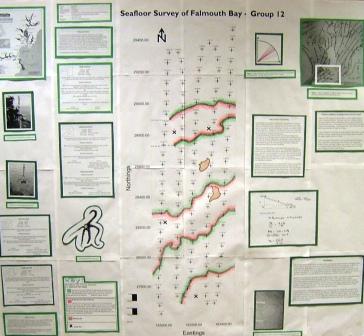 8
8
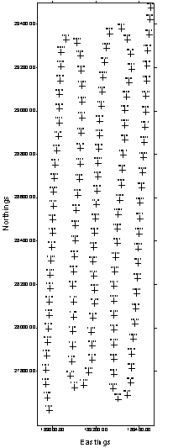
Figure 7 - Geophysics poster produced by Group 12 for data collected on the Grey Bear
Figure 8 - Track plot to show the 5 transects taken by the Grey Bear to survey part of Falmouth Bay