
Bill Conway - Lower Fal Estuary Analysis
| Return to Home Page | Grey Bear - Geophysics | Callista - Offshore Analysis | Ribs - Estuarine Analysis |
|
AIM:
To produce lateral (across and down the estuary) and vertical (through the water column) profiles of physical, chemical and biological parameters in the Fal estuary, moving downstream as the flood tide progresses. To observe how chlorophyll and nutrient concentrations vary with the physical conditions and together with RIB and offshore data try to build an overall picture of the phytoplankton variation from the head of the River Fal out to sea.
OBJECTIVE:
To create CTD profiles and ADCP transects which allowed site selection of key sample areas. At the estuarine end-members zooplankton nets (200 microns) were deployed at surface level at 2m depth for biological analysis of the plankton in the estuary for later investigation in the laboratory.
METHODS:
Due to the tidal pattern on the day (Low tide 1050 - 1.54m), it was decided to travel downstream as the flood tide progressed, starting at a location just South of the King Harry Ferry crossing. This would ensure that we would not sample the same body of water twice as we surveyed towards the estuary mouth. An ADCP was used to plot current magnitude and direction, with a useful backscatter function which would indicate any zooplankton activity. A CTD mounted on a 6 Niskin bottle rosette was used to profile the physical structure of the water column and to locate and sample any chlorophyll maxima. In total, 11 transects were made leading to 9 CTD profiles (Figure 1). The water samples collected by the CTD were used to investigate the oxygen, nitrate, phosphate and silicate concentrations once returned to the laboratory. A secchi disc was deployed at each station to provide a valuable indication of light penetration through the water column. A zooplankton trawl was completed at the most upstream transect and at the mouth of the estuary to aid the biological analysis.
1
![]()
Figure 1 - ADCP transect lines and CTD deployment sites for the Bill Conway boat practical, 9th July 2006
RESULTS:
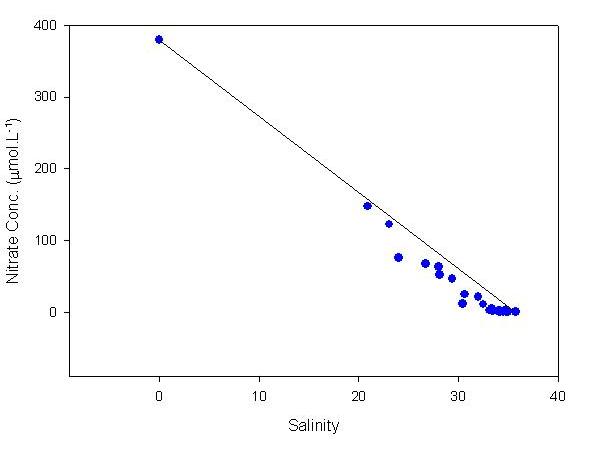
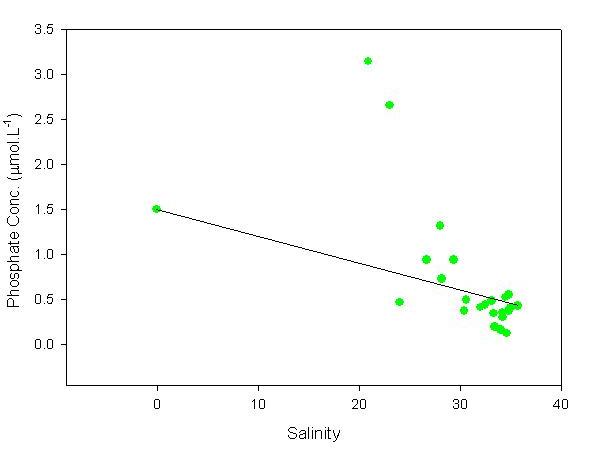
NUTRIENTS - The estuarine mixing diagrams incorporate the data collected by both the Bill Conway group and those on the RIBs, using previous measurements of the Truro River as the riverine end-member. All three nutrient concentrations show a general negative correlation where their concentration decreases as the salinity increases. The nitrate mixing diagram (Figure 2) shows the distribution of nitrate to be non-conservative with loss, undergoing slight removal along the length of the surveyed area. The phosphate mixing diagram (Figure 3) shows concentrations of up to 3.15 umol/L, almost twice that of the Truro River. This is so high that it is possibly anomalous, however, other groups results have shown the same pattern. In this way phosphate could behave non-conservatively with significant addition in its upper reaches. Dissolved silicon (Figure 4) behaves conservatively with salinity, showing little variation from the theoretical mixing line.
2
 3
3
 4
4
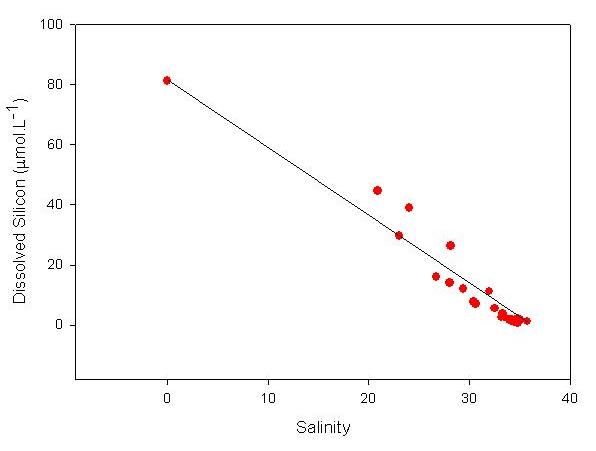
Figures 2 (Nitrate), 3 (Phosphate) and 4 (Silicon) - Estuarine Mixing Diagrams for the Fal estuary
Click on image to enlarge
It was found that there were two highly contrasting CTD profiles in the our survey of the Fal Ria system – one reasonably stratified and one homogeneous – that were particularly interesting to compare. These were CTD drop points 3 and 6, and are analysed below.
STATION 4 (CTD Drop 3)
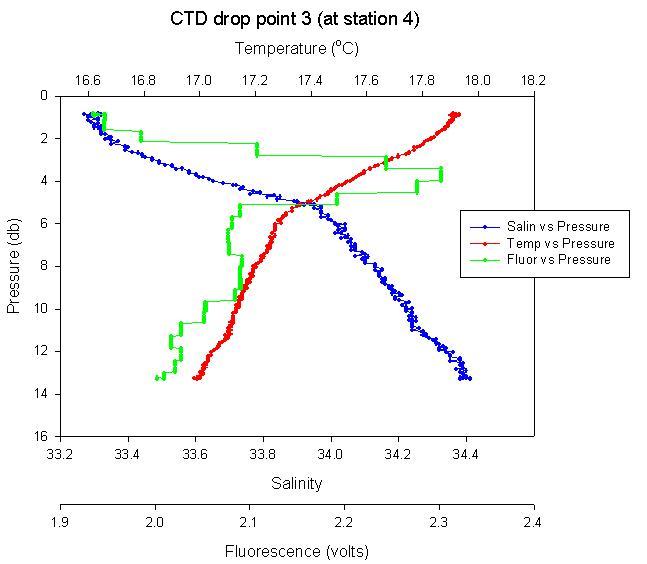
Physics - In terms of physical structure, the estuary is slightly stratified at CTD drop point 3 at the point of the fish farms (050.12.695N, 005.01.588W). On the CTD profile, there are two clear water masses, a surface layer down to about 5 metres, which stops at the base of the thermocline. This layer is more stratified than the layer beneath it, with stronger thermal and saline gradients down to 5 metres (17.3-17.9°C and 33.1-33.9 respectively). Beneath this surface layer the gradients to the bottom are less defined, with a temperature drop of 0.4°C and a salinity increase of 0.6 over 9 metres. The ADCP shows these two water masses to be flowing in opposite directions, the surface layer south out toward the lower estuary and the bottom layer in from sea (Figure 7).
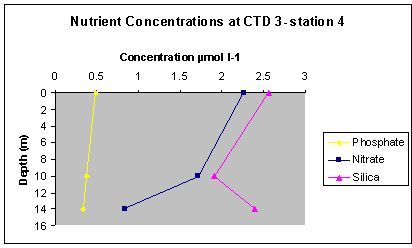
Chemistry - The chemical profile shows chlorophyll and all nutrients to be more concentrated in the surface layer. The nitrate concentration is 2.25μmol/L at the surface compared to 1.71μmol/L at 10 metres. The phosphate concentration is 0.11μmol/L greater between the surface and 10 metres, and silicate is also higher in the surface layer at 2.57μmol/L. The chlorophyll peak is very defined at around 4 metres, at the base of the euphotic zone which was 4.26 metres according to the secchi disk method.
5
 6
6
 7
7
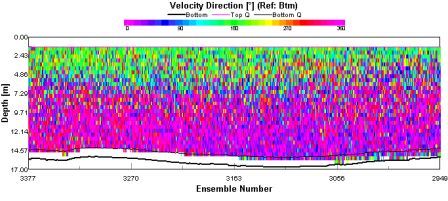
Figure 5 - CTD profile for station 4 showing temperature, salinity and fluorescence
Figure 6 - Nutrient concentrations at station 4
Figure 7 - ADCP profile of station 4
Click on image to enlarge
STATION 8 (CTD Drop 6)
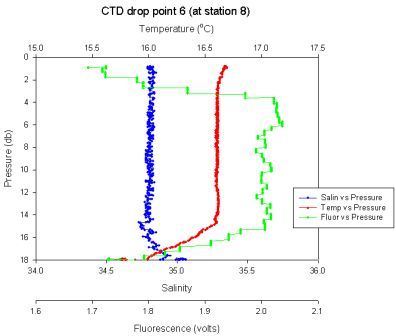
Physics - Station 8 at a location 50.10.808N 5.01.774W was the only observed site to have a uniformly mixed water column with a salinity of 34.7 and temperature of 16.7C down to a depth of 15m. From analysis of the CDT (Figure 8) cast 15m marked the boundary of a separate water mass which was more saline at 35 and cooler with temperatures down to 16C.
Chemistry - Phosphate, Nitrate and Silica concentrations (Figure 9) were observed at the surface at 0.5, 2.3 and 2.6micromol l-1 respectively. Phosphate concentrations declined marginally at what is shown on the graph as a constant rate with depth. The minimum concentration, which occurred at max depth of 14m, was 0.45micromol l-1. Nitrate declined with depth and was recorded at 10m at 1.7micromol l-1, below 10m a significant decrease in concentration was seen, the last recorded concentration was approx 0.8micromol l-1 at a depth of 14m. Silica showed a similar trend to nitrate with a recorded concentration of 1.9micromol l-1 at 10m. However at 10m in contrast to nitrate a significant increase in silica concentration was recorded back to a similar concentration as the surface at 2.5micromol l-1.
8
 9
9
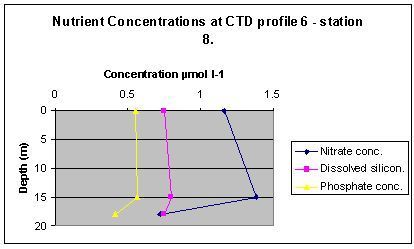
Figure 8 - CTD profile for station 8 showing temperature, salinity and fluorescence
Figure 9 - Nutrient concentrations at station 8
Click on image to enlarge
PHYTOPLANKTON - Phytoplankton samples were taken during the trip on Bill Conway at two stations, at two depths at each, towards the South of the Estuary. As you can see on the map (locations can be seen on figure 1), CTD 8 was dropped near black rock towards the mouth of the estuary and CTD 9 further up the estuary in the centre of the main channel. It is very clear that the main types of phytoplankton in the Fal estuary at this time of year are diatoms. Three types of ciliates were recorded but there was no sign of dinoflagellates, flagellates or coccolithophores. The species Rhizosolenia delicatula, Nitzschia Longissima and Rhizosolenia stolterfothii (all diatoms) are the most abundant at both stations (more frequent in sample 9) and all depths, between them appearing in every sample.
There are too main trends in general frequency. There is more phytoplankton found in the surface samples than at depth and also that there are higher numbers at both depths from sample 9 and therefore further up the estuary. There is also a higher diversity in sample 9, with 12 different species being apparent and only ten in sample 8, most of these being in the surface sample. The lower depths were chosen as the area around the small thermocline that was present, being 10m at station 8 and 6m at station 9.
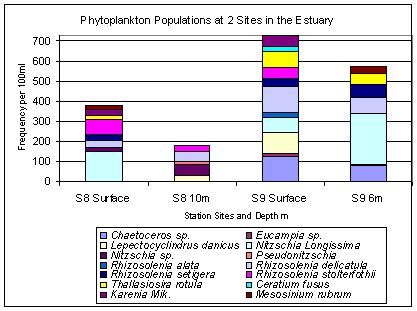
Figure 10 - Bar chart of phytoplankton species diversity from the Bill Conway boat practical, 9th July 2006
ZOOPLANKTON - The trends recorded in zooplankton data collected later in the week on Callista correlate closely with the trends in species abundance further up the estuary. Copepods were found in higher numbers offshore than at the mouth of the estuary, a trend which continued up the river. Data collected on Bill Conway recorded ~780 individual copepods per cubic metre at the mouth of the estuary, station 2 (50.08.448N, 005.01.556W to 50.08.998N, 005.01.109W). Station 1 in the mid estuary had lower numbers of copepods, at ~400 individuals per cubic metre (50.08.448N, 005.01.556W to 50.08.998N, 005.01.109W).
Cladocerans also followed a trend that was continued from offshore and up the estuary. No Cladocerans were found at the stations farthest from shore whilst on Callista, but started to appear towards the mouth of the estuary. This trend continued up the estuary on the Bill Conway. At Station 2 numbers of individuals per cubic metre had doubled from ~50 at station 2 to >100 at Station 1. Refer to Figure 6 below. Diversity of species increased from the mouth towards the head of the estuary. 16 different groups of zooplankton were recorded at station 1, compared to only 10 different groups at station 2.
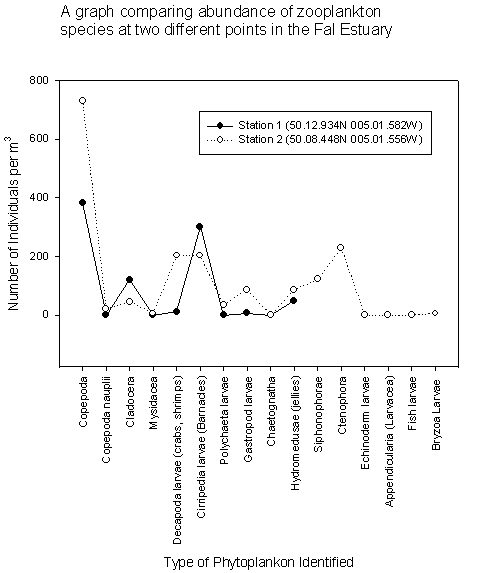
Figure 11 - Graph to show abundance of zooplankton species at two stations from the Bill Conway Boat practical, 9th July 2006
Click on image to enlarge
DISCUSSION:
NUTRIENTS - Nitrate showed slightly non-conservative behaviour with loss due to uptake from plankton, but not at such an extent that a bloom could be described. Phosphate concentrations showed significant addition during the upper reaches of the Fal estuary, most likely attributed to surface run-off of fertilisers from agriculture. Silicates showed conservative behaviour despite the diatom dominance in the estuary, again indicating there is no major bloom event occuring at this time of the year.
STATION 4 (CTD Drop 3)
Physically speaking, it seems there was a secondary circulation system further up the estuary at low tide. It may be that the slight stratification seen at the fish farms was due to the sampling time which was just after low tide, which would reduce any tidal mixing influence, allowing the static stability of the water column to increase. The fish farms might contribute to the high nutrient concentrations found in the surface layer flowing toward sea. The bottom layer is still inflowing from the mouth of the estuary, which would be expected to have a lower concentration of nutrients, as show by the estuarine mixing diagrams above. However, it should be noted that there are only 3 sampling depths for our nutrient analysis. It would be desirable to have a higher frequency profile in this respect as there is no record of nutrient concentration at the boundary between the two water bodies.
STATION 8 (CTD Drop 6)
The nutrient data is difficult to interpret correctly as only 3 depths were sampled; this is why linear lines appear on graphical representations. Actual concentrations patterns are probably quite different, however the significant changes in nitrate and silica concentrations below 10m support the CTD analysis that at approx 14m exists a separate water mass, the colder temperature and higher salinity suggesting that this water mass originates from the mouth of the estuary. The uniform water mass that exists down to 14m is presumably well mixed with the riverine element of the estuary due to the higher levels of nutrients and lower salinity. The fact that this was the only station that was observed to have a well mixed water column could possibly be attributed to the bathymetry of the seafloor. The station towards the seaward side showed a much wider deep channel compared to the narrow deeper channel observed on ADCP at station 8. An incoming tide would create much more turbulence at station 8 as it was pushed through the narrower channel, this could be why the water column is observed to be very well mixed in comparison to other sites sampled.
PHYTOPLANKTON - The reason for there being a lower phytoplankton population further out towards the bay could be because the conditions are less stable, meaning that a lower frequency and diversity would be expected. The instability would be caused by the greater tidal effect and the deeper water not being so readily stratified. This can be seen on the CTD graphs. It is clear that diatoms are still dominating the estuarine waters. Obviously, the silicate levels are still high enough to maintain their populations and if and when this begins to decline and become limiting for the diatoms then other plankton groups will bloom. As this will happen further along in the summer, it is likely that the waters will be more stratified which will also suit plankton groups such as the dinoflagellates, which are as yet to make a presence.
ZOOPLANKTON - The continuing trends from offshore to inshore and further up the estuary suggest that conditions within the estuary are far more stable than would be expected. This is confirmed by all of the data collected from various other boats and instruments. Vertical profiles of temperature and salinity in the upper estuary show very stable conditions, with virtually no freshwater input and stable water columns as far as Truro. Salinity is ~33 throughout the entire depth of the water column in mid estuary, freshwater has only been recorded in the top few cm’s of water. This leads to an increase in the diversity of species as conditions become stabilised further up the river. In the more unstable conditions further down the estuary, copepods are able to show more dominance, out-competing other zooplankton species. This would further confirm the idea that copepods are ‘r’ selected species, which are able to thrive in unstable conditions. The correlation of data shows good scientific sampling, 10 different groups of zooplankton were recorded in the mouth of the estuary while onboard Callista, and the same diversity was recorded from a similar position whilst onboard Bill Conway.