

Falmouth Field Course 2017


The views and opinions expressed on this website are not necessarily those expressed by the University of Southampton or the National Oceanography Centre. They are purely representative of the authors of this website.


Meta data
Date: 04/07/17
Time: 12:00-13:45 UTC
High water: 01:22 and 14:00 UTC
Environmental conditions:
- Cloud cover = 7/8
- No rain
- Temperature(°C) 15-17
Tidal State: Neap flood tide
Vessels: Winnie the Pooh,
Bill Conway
Equipment Inventory
Introduction
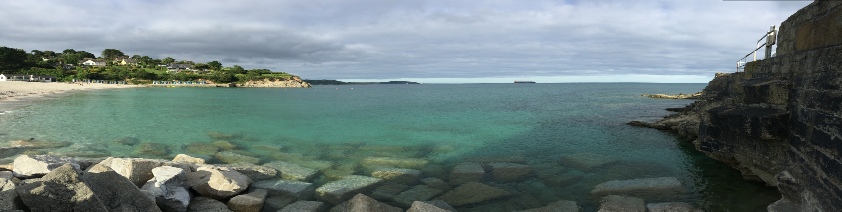
To assess estuarine conditions a transect survey along the Fal was conducted on the 4th July 2017, aboard the R.V Bill Conway. The survey was made up of five different stations 13, 14, 15, 16 and 17, forming a transect from the upper more lotic, to the lower more marine regions of the estuary. Various instruments were deployed to measure the parameters at each station. This was in order to assess and analyse changes in biological, chemical and physical parameters along the length of the Fal estuary.
Previous studies of the estuary suggest a high susceptability to eutrophication in the upper Fal so much so that it has been classified as a Sensitive Area (under the Nitrate Directive 91/676/EC)(Langston, et al., 2003) .
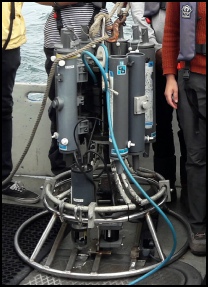
CTD Rosette
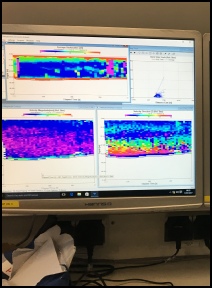
ADCP
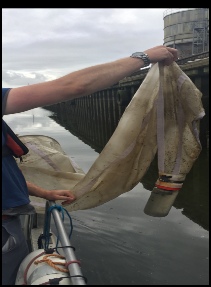
Plankton Trawl
Methodology
A CTD rosette with (7) Niskin Bottles and a T/S probe, was deployed from the stern. This measured the physical parameters and collected water samples at different depths through the water column. Due to an engine failure at 12:44 UTC, the rosette was unable to be operated at the stations 14-17. At these stations, surface water samples were collected manually. These samples were tested to determine dissolved silicate, nitrate, phosphate and oxygen concentrations. A multibeam ADCP was used to measure current cross-sections. The biology of the estuary was assessed by identifying and enumerating zooplankton species - sampled using a tow net (200µm mesh size and 50cm diameter) at 2 knots between stations 16 and 17. Phytoplankton samples were collected with the CTD (for station 13) and then from subsequent surface water samples.
Fig.1: Google Earth map of all sites sampled in the Fal estuary on 4/7/17
Table.1: Time and locations for each station sampled in the Fal estuary on 4/7/17, with increasing salinity along the transect.


References
Langston, W.J., Chesman, B.S., Burt, G. R., Hawkins, S. J., Reedman, J., & Worsford, P. (2003). Site Characterisation of the South West European Marine Sites. Fal and Helford cSAC. Plymouth Marine Science Partnership. Retreived July 13, 2017
| Biology |
| Chemistry |
| ADCP Transects |
| Physics |
| Biology |
| Chemistry |
| Physics |
| Sidescan Sonar |
| Video Surveys |