
Date: 29/06/2013
Station 2:
Low tide: 4:40 UTC (0.7m) & 16:02 UTC (0.90m)
High tide: 09:31(4.60m) & 21:48 (4.70m)
Cloud: 25%
Wind: 15mph
Offshore
Methods:
- Dissolved oxygen: This was collected by placing a tube from the Niskin bottles straight into the glass bottles ensuring that no air bubbles were in the bottle. One glass bottle sample was collected for each depth. 1ml of Manganous chloride and alkaline iodine were added to ensure that the oxygen in the bottle was fixed and would not change (this is why we had to make sure there were no bubbles in the bottle). After the reagents were added, the bottled samples were put into a bucket of water to keep it homogenous and avoid the release and/or absorption of atmospheric oxygen. This was then brought to the lab for analysis.
A 500ml bottle was filled with water from each depth, which was used to test for chlorophyll, nutrients, silica, salinity and phytoplankton.
- Chlorophyll: 50ml of water from each depth was taken and filtered using a syringe to remove the chlorophyll, and the filters were then placed into 7ml of 90% acetone. This was done twice.
- Silica: The silica analysis was done with the chlorophyll-filtered water to avoid a change in the sample due to the uptake of silica and nutrients by the phytoplankton.
- Nutrients: The nutrient (NO3) analysis was also done with the chlorophyll-filtered water.
- CTD: The CTD was attached to a rosette bottle frame, and then lowered through the water column whilst sampling continuously. Once a profile of the water columns features were generated water samples were taken on the way up as the CTD was raised. Generally 3 samples were taken one below, one during and one above the chlorophyll maximum. Samples were collected using 10L niskin bottles that were fired sequentially via an electronic system.
- Secchi Disk: Due to the clarity of the water column, the secchi disk was unable to be used as the length of rope, which it was attached too short. It was therefore decided that the CTD and rosette frame were to be observed until they disappeared from sight and the depth recorded. A calibration curve will later be produced from the light meter on board the CTD to determine a ‘CTD depth’, which will be analogous to secchi depth.
- Closing net: In order to observe the zooplankton at a specific depth range, the closing net was used. It was deployed to the deepest depth required then dragged up through the water column to the minimum depth of the sample zone. A messenger was then deployed to close the net so that when the net was dragged up to the surface again, no plankton could enter the collection bottle. The mesh size of the net was 200µm and the area of the nets opening was 565.5 cm2. Samples were taken at chlorophyll maxima and surface.
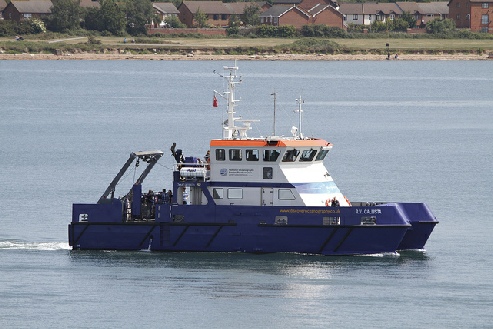
John Ambler , (2011), R.V. Callista [ONLINE]. Available at:http://www.flickr.com/photos/14636434@N02/sets/ 72157616615163124/detail/?page=12 [Accessed 01 July 13].
Results:
Temperature-Salinity
Temperature and salinity profiles were plotted from the CTD data obtained at each time. Data was collected at 4 different times, and the graphs are presented below.
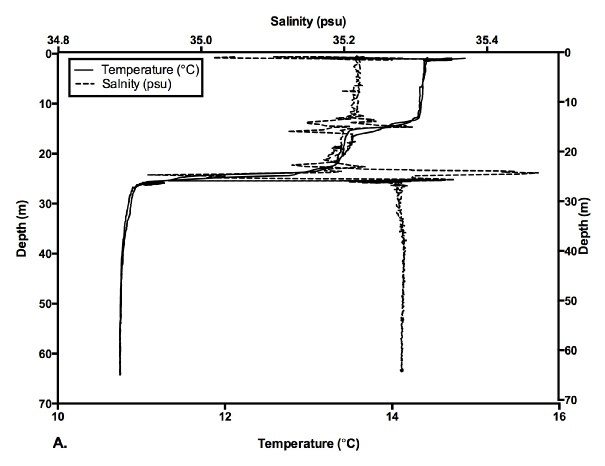
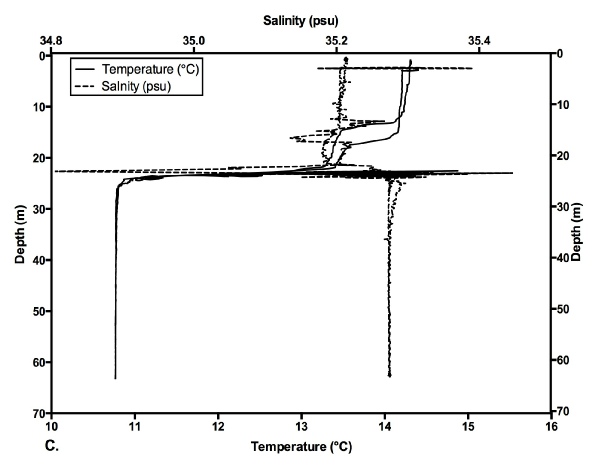
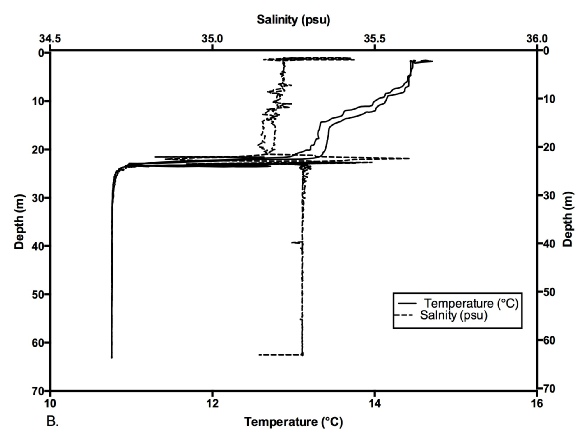
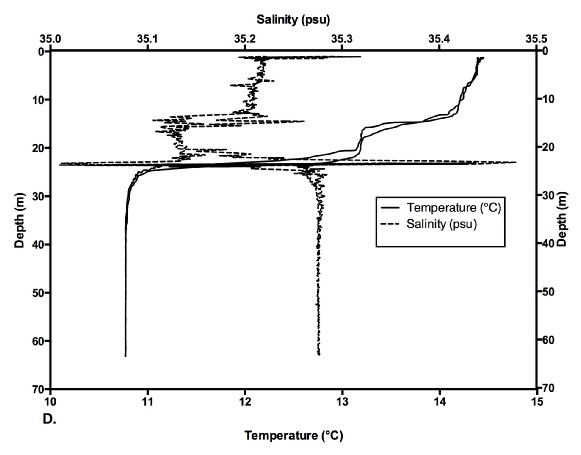
As all the data was taken at the same station (station 2) we would expect similar results for temperature and salinity at the different times taken as the overall time difference between the first data set taken and the last was only about 4 hours. The general trend shown in the graphs above is a decrease in temperature as depth increases. The thermocline stops at about 25 meters for each data set and at a temperature of about 10.8 ˚C. This consistency at depth between the data sets is expected as there are fewer factors influencing the water below the thermocline. We see a difference in the surface temperatures between the data sets, however, which could be explained by a number of factors. Although we would have liked the ship to be stationary while sampling, this was not actually possible due to wind, and currents. Therefore it is likely that even though samples were taken at station 2, the samples were probably taken somewhere within roughly a 1km area surrounding station 2 . The surface temperature would also be influenced by cloud cover, wind and currents and time of day, incident radiation tends to be highest around 12pm at mid latitudes and lower before and after.
The salinity data shows that the halocline stops at around the same depth as the thermocline does. This is more likely because of processes occurring at the boundary between the mixed layer and the homogenous deep layer of water, rather than some obscure relationship between the thermocline and halocline. The graphs also show a higher salinity deeper in the water column which is explained by freshwater run off, and mixing in the surface layers which reduce the surface salinities in this coastal setting, although it is tempting to discuss deeper salinities being a result of thermohaline circulation (cold and salty), the depths typically experienced in this setting are well above the threshold for any such speculation.
Transmission:
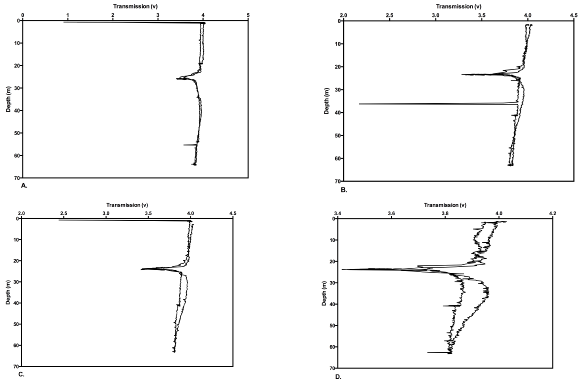
The fluorometry data can be used as a way to indicate the presence and abundance of chlorophyll in the water column. This data can therefore be used to produce a rough estimate of phytoplankton abundance. We again see a peak in voltage around the chlorophyll maxim, at about 25-30m.
- AIMS: To create a continuous time series of data from a fixed point offshore of Falmouth Bay
- OBJECTIVES: To over a time series:
- To determine the concentrations of Si, P and N at varying depths
- To determine the temperature profiles
- To determine turbidity profiles of the water column
- To determine the fluorometry profiles of the water column
- To determine the discrete chlorophyll concentrations of water samples at varying depths
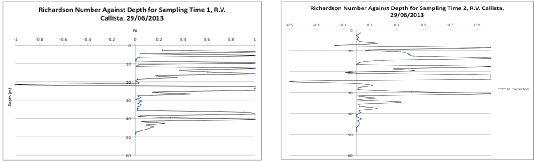
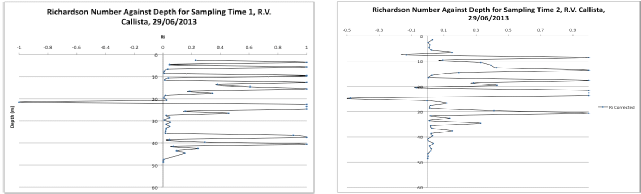
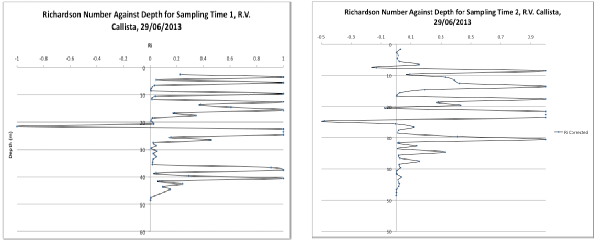
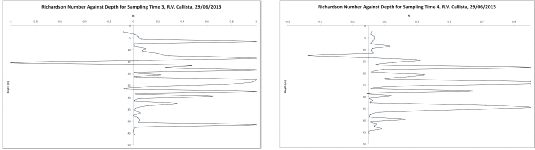
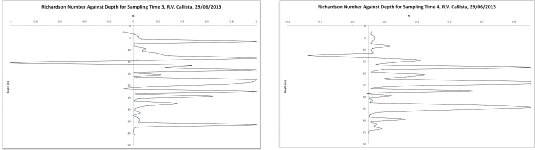
Richardson numbers produced form the averaged ADCP data for each sampling time show very low stabilities between water layers around the chlorophyll maxima at 20-30m water depth. This may show that the phytoplankton tend to be present in areas of high vertical instability where nutrients are mixed up from deeper colder water, to warmer, light rich surface waters where they can propagate easily.
Discussion:
The data seen shows profiles typical of offshore waters. We see a clear thermo and halocline with colder, more saline waters deeper in the water column and warmer less saline waters in the surface layers. The thermo and halocline occur at the boundary between the mixed layer and the lower layer of homogenous water. Chlorophyll maxima were detected within 20-30m water depth with some smaller chlorophyll maxima being detected at deeper and shallower depths, although these are arguably instrumental errors. The chlorophyll maxima were indicated using flourometry, transmission and ADCP data that all matched up to provide a convincing and detailed picture of how the phytoplankton are reacting to chemical and physical conditions in the water column. The chlorophyll maxima incidentally occurs at the same depth as the thermo and halocline, as seen in a study by Jordan & Joint in 1984 at the L4 station in Plymouth.