
Date: 26/06/2013
Location: 50°12.57'N, 005°01.39'W
Low tide: 02:31 UTC (0.1m) and 14:50 UTC (0.3m)
High tide: 08:15 UTC (5.1m) and 20:31 UTC (5.4m)
Cloud: 6% (9:00 UTC) & 12% (12:00 UTC)
Wind: 5.5mph
King Harry Pontoon
Introduction
The Fal is a tidally dominated estuary, affected by physical, biological and chemical processes. To understand how these change moving up the estuary, measurements were taken using a CTD aboard RV Bill Conway and samples were taken for chemical and biological analysis. However in order to get an insight into how the estuary changes throughout the day, measurements were also taken from a pontoon located in the upper Fal (50° 012.570’N, 005° 001.390’W). Measurements were taken (during an ebb tide) every 30 minutes over a period of 3.5hours starting at 08:50UTC and ending at 13:20UTC, providing a time series of data.
Materials & Methods
Current Velocity
- Current Meter: The current meter was lowered into the water and kept at the surface. The speed and direction of flow was measured in m/s and degrees respectively. Due to an issue with the functionality of the probe flow data was not collected until 10:20 UTC and therefore only four recordings could be taken. Due to equipment failure and attempted repairs, data was not collected at 10:50 UTC. The current meter only collected data at the surface and collection resumed at 11:20 UTC.
Irradiance
- Light Meter: two 2pi light sensors were used to determine irradiance at the surface and at differing depths. TheIrradiance was measured every 30 minutes beginning at 08:50 UTC and ending at 12:20 UTC. Irradiance was recorded at the surface then at 1m intervals until the sensor reached the benthos.
- Secchi Disk: The water transparency was measured using a secchi disk. The secchi disk was deployed every 30 minutes from 8:30 UTC until 12:20 UTC. It was lowered until it was no longer visible to determine the secchi disk depth.
- YSI Probe: The YSI probe was lowered into the water column and data was collected close to the benthos at 30 minute intervals starting at 08:50 UTC. The YSI probe measured multiple parameters including Depth, Temperature, Salinity, pH, %DO, DO (mg/L) and Dissolved Organic Chlorophyll.
- AIMS: To create a continuous time series of data from a fixed point on the Fal Estuary
- OBJECTIVES: To analyse measurements were taken by a current meter, light meter, Secchi disk and YSI probeevery 30 minutes over a period of 3.5hours starting at 08:50UTC and ending at 13:20UTC, providing a time series of data.
Results
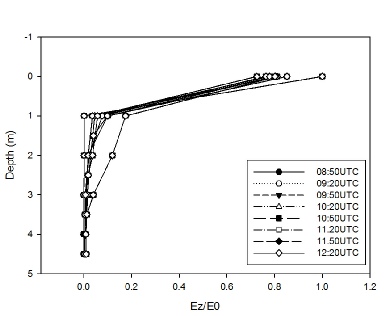
The results for the light data varied quite dramatically throughout the day, largely due to severe changes in the cloud coverage (fig. 1).
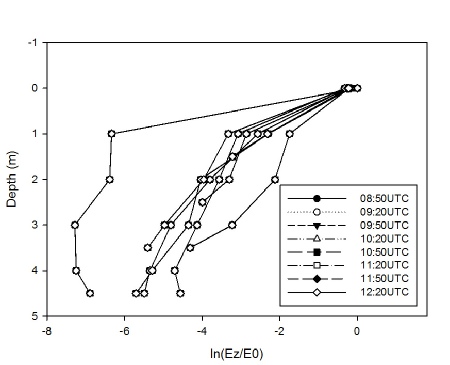
This was reflected in the variation of the attenuation coefficient (k) which increased throughout the morning from 0.2 to 0.267. The value for ln(Ez/E0) (fig. 2)decreased with depth each time a set of measurements were taken.
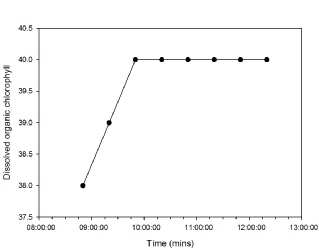
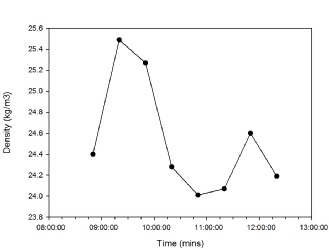
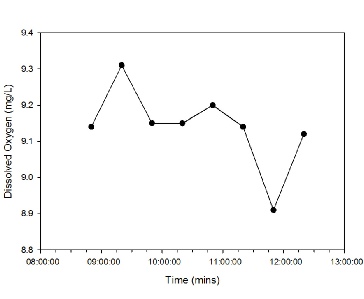
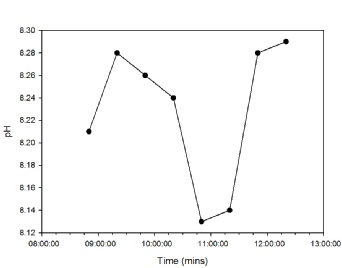
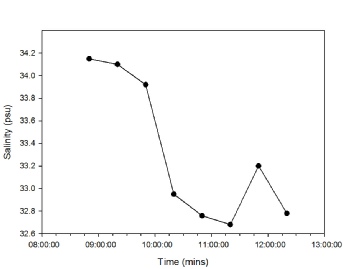
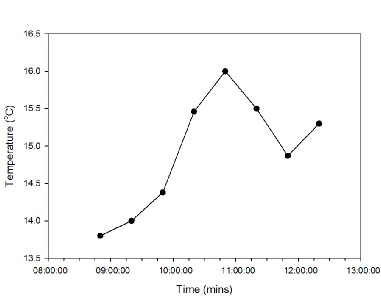
The pH (A, fig. 3) remained fairly constant throughout the day ranging from 8.13 – 8.29. Salinity (B, fig. 3) ranged from 34.15 at the beginning of the day to 32.68 at 11:20. Temperature (C, fig. 3) increased from 13.8°C at 08:50 to 15.3 at 12:20. Dissolved oxygen (D, fig. 3) remained high throughout the day, fluctuating around 111% for most of the day, whilst its concentration remained around 9mg/L for all recordings. Dissolved organic chlorophyll (E, fig. 3) started at 38 increasing to 40 by 9:50 and remaining so until 12:20. Density (F, Fig. 3) increased for the first stations before a sharp decline at 10:20UTC. There was then a small peak of 24.6kg/m3 at 11:50UTC.
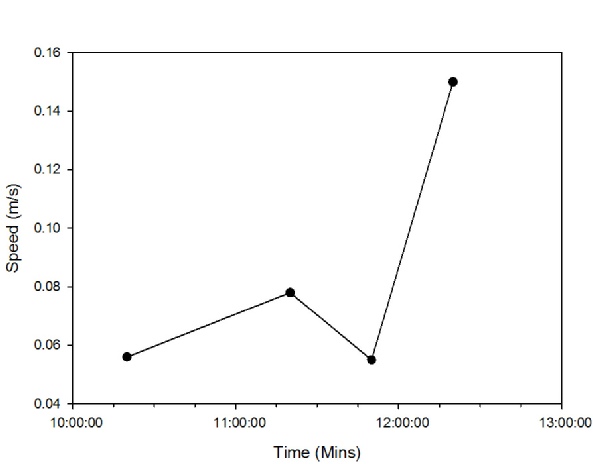
Flow (fig. 4) speeds were slow throughout the day, beginning at 0.056m/s at 10:20 and then speeding up to 0.15 by 12:20 as the tide moved out.
Discussion
The day of collection was sunny with some clouds. As the day progressed, the cloud coverage increased until the sky was 7/8 cloudy. The tide was going out for the duration of the collecting period with a high tide was at 06:58 UTC and the low tide at 13:38 UTC. As the tide turned the mass water movement was downstream and the flow increased, this can be seen in the data from the current meter.
Most of the parameters decreased as the study time progressed, most likely as a result of the tide. As the mass movement of water moved downstream the salinity decreased as it was replaced by a greater proportion of fresh water (Uncles et al, 2002). Seawater also has a greater density which explains the decrease in density.
There is a peak in salinity, temperature, dissolved oxygen, density and pH at the 11:50UTC set of data. This cannot be explained by any conventional estuary processes but could be due to the various passenger ferries, harbour master and RV Bill Conway that pulled up to the pontoon throughout the day (Estuarine and Coastal Sciences Association, 2002).
There are some limitations to this time series however. The current meter was not working at the surface for the first few measurements and not at all at depth for the duration of the investigation. This removes a key parameter as the flow speed was not measured for any depth below the surface and as a result any possible underwater currents would not have been observed. It would have also been useful to have recorded data at metre intervals for the YSI probe as this would have allowed direct comparison of the same depth throughout the day as opposed just the bottom depth.
References
Estuarine and Coastal Sciences Association (2002). Nutrients and Eutrophication in Estuaries and Coastal Waters. Estuarine and Coastal Sciences.
Uncles, R.J., Stephens, J.A., & Smith, R.E. (2002). ‘The dependence of estuarine turbidity on tidal intrusion length, tidal range and residence time.’ Continental Shelf Research. 22 (11-13), 1835-1856.
Summary
- As a result of the outgoing spring tide, most of the parameters generally decreased except flow which increased.
- There was an unexpected peak in salinity, temperature, dissolved oxygen, density, and pH which may be attributed to boat traffic.
- There were a few malfunctions with equipment including the current meter, affecting the quality and quantity of the data collected.
Figure 1:The exponential decrease in Ez/Eo with depth for each measurement interval in the series
Figure 2:The natural log of Ez/Eo against depth for each measurement interval in the series
Figure 3: A-F: Time series for pH, salinity, temperature, dissolved oxygen, dissolved organic chlorophyll and density.
A
B
C
D
E
F
Figure 4: A-F: Time series for current velocity (m/s)