 Back to Top
Method:
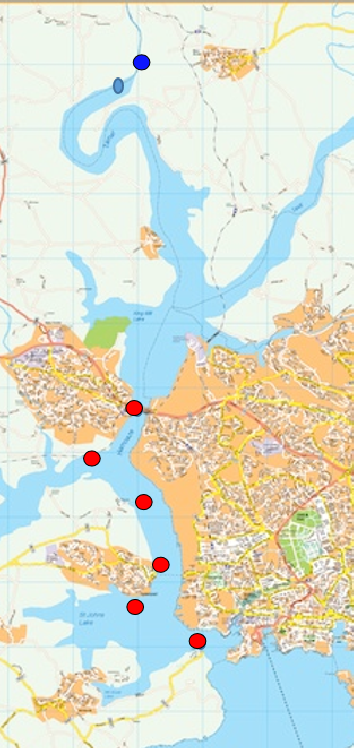
The Falcon Spirit travelled from the sea end of the estuary up towards the River Tavy confluence, where passage was limited by water depth.
A total of 9 stations were sampled along the estuary in the following order; H -
At each station data was collected using a CTD rosette with attached niskin bottles and ADCP system running during the CTD profile and a transect across the channel. In addition, zooplankton trawls and secchi disks were deployed at various sites. (See Vessels for more details)
On the Falcon spirit the water samples from the niskin bottles were processed and
stored for testing of different nutrients back in the lab. A sample was collected
for Oxygen content, a sample collected for preserving phytoplankton in lugols solution,
and then samples collected for nutrient analysis – silicon, nitrate and phosphate.
A temperature-
Unfortunately due to an accident with the cooler several of our chlorophyll samples were lost over the edge of the pontoon and so some of our data is limited
Aim:
Groups 3 and 4 spent the day on the Tamar estuary collecting water samples the aim being to assess the stratification and nutrient distribution within the water column along the estuary system using two vessels and various pieces of equipment. We also aimed to investigate the changes within the system following the increasing salinity of the transect from the riverine to seaward end member.

Method:
Winnie the Pooh travelled from the riverine endmember to the Saltash pontoon
sampling station, using a temperature salinity probe along the way to determine sampling
locations. At each change of approximately two salinity units. As on the Falcon Spirit
the sampled water was stored to test for phytoplankton, silicate and phosphate in
the lab the following day.
Site C
Site D
Site E
Site F
Site G
Site H
Site J
Site I
Site B


Click on each site to see the data
Figure 26: Estuarine mixing diagram of nitrate concentration for the Tamar estuary from Calstock to Plymouth Breakwater. Theoretical dilution line between river and seawater endmembers. Nitrate concentration decreases rapidly from the riverwater endmember to salinity 4.2 where the concentration is 75.4500µmol/L. Nitrate concentration decreases linearly below the TDL, showing removal below the TDL. Nitrate concentration is lowest at the seawater endmember with a concentration of 1.4670µmol/L.
Figure 27: Estuarine mixing diagram of phosphate concentration for the Tamar estuary from Calstock to Plymouth Breakwater. Theoretical dilution line between river and seawater endmembers. Phosphate concentration decreases rapidly between salinity of 0 and 5, decreasing well below the TDL. Between salinity of 10 and 15 there is addition, where phosphate concentrations increase to the TDL. Between salinity of 15 and 23 phosphate removal follows the TDL, at salinity 30 there is increase above the TDL where concentration reaches 0.7µmol/L, followed by a sharp decrease to the seawater endmember.
Figure 28: Estuarine mixing diagram of silicate concentration for the Tamar estuary from Calstock to Plymouth Breakwater. Theoretical dilution line between river and seawater endmembers. Silicate concentration decreases rapidly from salinity 0 to 4.2, a decrease of 43.03 µmol/L showing strong removal of silicate. Silicate concentrations remain very low, well below the TDL as salinity increases to the seawater endmember.
Figure 29: Nitrate, Phosphate and Silicate concentrations change with salinity from Calstock to Plymouth Breakwater along the Tamar estuary. Nitrate concentration decreases fairly linearly as salinity increases above 5. There is a sharp drop in nitrate, phosphate and silicate concentrations between 0 and 5. Phosphate concentration drops initially from 1.0µmol/L to 0.5µmol/L followed by some increase at salinity of 15, dropping again after salinity of 20 with an increase at salinity of 30 followed by a further rapid decrease to a minimum of ~0.2µmol/L. Silicate concentration drops initially from 47µmol/L at salinity 0 to 3µmol/L at salinity 4.4, after which it decreases to almost 0µmol/L with some increase at salinity of 30.
Figure 26
Figure 27
Figure 28
Figure 29
Site 1
Site 2
Site 18
Site 17
Site 13
Site 5
Site 8
Site 7


Figure 30
Figure 31
Figure 30: Plot of nitrate concentration against phosphate concentration at each station from Calstock to Plymouth Breakwater. Nitrate to phosphate ratio does not fit Redfield ratio suggesting increased addition or removal nitrate or phosphate.
Figure 31: Nitrate to phosphate ratio against salinity at each station from Calstock to Plymouth Breakwater. N:P ratio appears to decrease fairly linearly as salinity increases. N:P Ratio is highest at salinity of 10, where it is 217.5 showing nitrate levels far above Redfield ratio. At higher salinities between 30 and 35 N:P ratio is closer to Redfield ratio with ratios between 15 and 6.5, showing some removal of nitrate below Redfield ratio.


Figure 32
Figure 33
Figure 34
Figures 32, 33 and 34 show the change in Richardson number with depth at three sites along the Falcon Spirit’s transect of the estuary. At each of the sites the Richardson number was high which indicates that although there is a clear geographical separation down the estuary the conditions experienced in terms of the water flow and the forces exerted are relatively similar. Using this data we could go on to investigate the flushing times of the estuary and how this impacts some of the other conditions we have surveyed as part of this investigation.
T/S profiles of the estuary show a general trend of increasing salinity with depth and decreasing temperature with depth. Estuarine mixing diagrams show a removal of silicate (concentrations are very low and constant). This could be due to the uptake by organisms such as diatoms that use this nutrient for building their shells. We also observe fluctuating concentrations of phosphate, where we have some removal in lower salinities and addition in higher salinities. Concentrations of nitrate are much higher than those of the two other nutrients, and there is removal. Nutrient profiles from each station show different behaviours. Some stations show a decrease of all three nutrients at the surface, which correlates with the uptake by phytoplankton, and an increase a depth. Some profiles also show an increase of nutrients at the surface. This increase could be due to external inputs. In addition to this the knowledge taken from the Redfield ratios showing how the various nutrients interact support this initial finding.