 Back to top
Results
CTD
We have processed the data from onboard Callista, to plot the Temperature, Salinity and Density. We have done this for all three stations C1, C2 and C3 in order to create a direct comparison of data as we moved further offshore. Across the three profiles, the temperature follows the same pattern with a higher temperature at the surface, then a gradual decrease and a homogenous temperature at higher depths. The salinities also have similar patterns with an increase with increasing depth. The salinity at the C1 site is considerably lower than that of the other sites, which is likely to be due to the larger influence from the estuary as this location is furthest inshore. The density readings are a direct combination of the temperature and salinity together, as with increase temperature the density decreases and increased salinity the density increases. From the densities it shows that on all three locations there is a density gradient, with an increase with increasing depth.


MiniBat
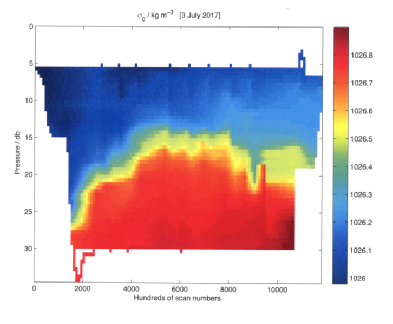
Using the MiniBat, we ran a transect using Callista to collect the varying data from offshore towards the land. The data has been processed to show temperature, salinity, density and fluorescence across the transect.
At the beginning of the transect, the thermocline is deeper at over 25m however as the transect moves inshore the thermocline becomes shallower, sitting at around 15m. The surface temperature and association water mass before the thermocline is higher offshore than it is further inshore. From a thermal perspective the water column is stratified across the transect.
The salinity profile has much less stability across the transect than the temperature. At the beginning of the transect the column looks to be homogenous however this could be due to an increase in the depth of the halocline which is lower than the 30m measured. As the transect moves along there are waves of salinity patches, where the water column becomes more and less mixed cyclically. Towards the end of the transect it becomes again stratified, with two clear layers.
As density is altered by the temperature and salinity, the profile follows the pattern of the temperature and salinity combined. Due the stability of the thermal gradient, the density is also consistent following the thermal, which suggest the heating aspect has more of an impact on this transect than the salinity changes.
Fluorescence can be used to show the presence of Chlorophyll in the water column.
As the figure shows there is a clear layer among the water column that that higher
levels of fluorescence within the water column at a varied depth of 15-


ADCP
Station 1, being the furthest inland, exhibited the most laminar flow throughout the depth profile; this indicates that this station had a more stable water column. Spikes in the laminar flow are representative of the thermocline and deep chlorophyll maximum. A weak backscatter signal from biota is observed between 15 and 25m, coinciding with the deep chlorophyll maximum where the plankton samples were extracted. The weaker signal may be attributed to higher velocities at these depths.
Station 2 was further out to sea than station 1, hence the more turbulent flow present. Again, peaks in laminar flow may be observed in the region of the thermocline and the deep chlorophyll maximum. Overall, the frequent changes in Richardson number may be indicative of an unstable water column, and the horizontal variability near the deepest parts of the water column may be attributed to bottom friction. Backscatter signals from plankton betweeen 26 and 30m are coincidental with the DCM.
Station 3 was the furthest out to sea, explaining the larger proportion of turbulent flow throughout the profile. There are 3 distinct water masses displayed: a turbulent, mixed surface layer, a stable water mass around 30 to 40m (in the region of the thermocline and the deep chlorophyll maximum) and a turbulent, mixed bottom layer. Backscatter signals show accumulations of plankton between 15 and 20m. The highest velocities in this water column were towards the surface, but were mainly constant throughout depth.


The views expressed here are not representative of the University of Southampton.