Back to top
Introduction
The Fal is home to a range of habitats (Maerl beds, subtidal/intertidal shores, sand and eelgrass beds), which are all protected the DEFRA (Department for environment, food and rural affairs), as a SAC (special area of conservation).
This habitat mapping of a small section of the Fal Estuary and the Fal river took
place on the 8th of July, at 07:12 UTC. Five Sidescan transects were taken (all
in parallel with each other), covering a reasonably large segment of the area. Although
the side scanner gave us insight into interesting areas along the transects, we were
unable to determine what was creating these interesting points and so a camera was
deployed at two points of interest for ground-
Chart datum suggested that the sediment type that was present was eel-
Methods
To provide a large-
Groundtruthing was used to verify the interesting features picked up by the sidescanner.
Video imaging of the benthic habitat was carried out along 2 transects on the River
Helford and one a little further out (where a grab was also taken). Video was used
to supplement the side scan data by ground-
A Van Veer grab was used to establish the sediment and identify organisms in the
habitat at site 2 (50o 06.0N, 5o 06.5W). The video was deployed to determine whether
a grab could be performed but also to build an image of the overall habitat. There
was cloud cover of 3/8, and a sea state of 0, which made for very clear video recordings.
The grab allowed us to determine sediment size and composition (we used sieves on-
Results
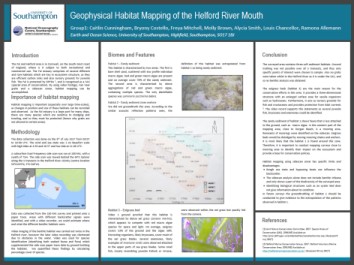
Our group created a poster displaying our findings from the survey, please click on the image to enlarge.
The views expressed here are not representative of the University of Southampton.