References
1http://jncc.defra.gov.uk/protectedsites/sacselection/sac.asp?EUCode=UK0013112
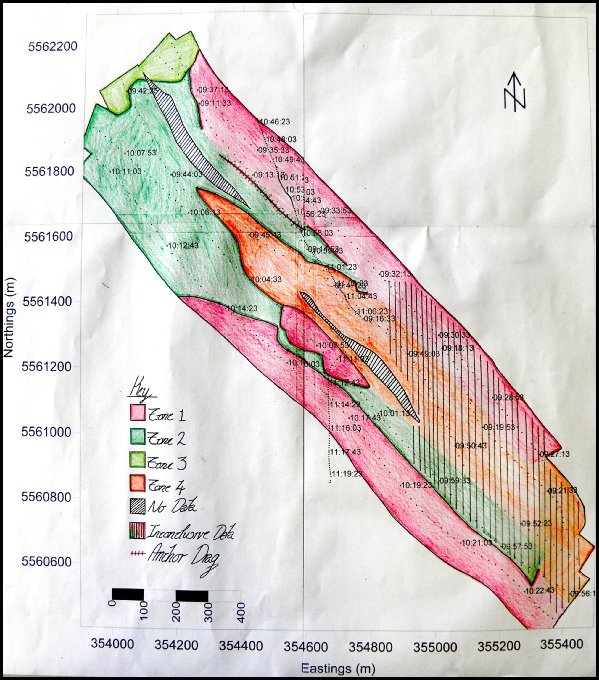
Zones:
Zone 1 consists of a dense covering of algal species, predominantly Rhodophyta with some Chlorophyta. It also appears to have a relatively diverse benthic epifaunal community.
Zone 2 appears to have the same basic community structure as Zone 1 but less dense algal coverage and regions of exposed gravely sediment.
Zone 3, which was not grounded, gives a similar result as Zone 2 on the backscatter but with a smaller sediment size shown on the sidescan in a lighter shade.
Zone 4 showed a more exposed coarse sediment where the dominant organisms were suspension feeding bivalves. This area coincided with removal of sediment in the deep channel.
There was also an Anchor drag, see map; width was 40cm from sidescan. This corresponds to a common two fluke yacht anchor. The still shows impacts on the Benthos.
Results and Limitations
Four probable zones were found in the sidescan backscatter results. Three of the
four were grounded by video tows roughly north -
There are a number of limitations to the results particularly in the southern end
of the sampled area (labelled Inconclusive Data). In this area very little should
be inferred from the results as the lack of grounding in this area has lead to a
disparity between sidescan and video data, with no obvious boundaries for the three
zones that are seen though grounding. As well as the poor data quality due to conditions
this lack of clarity of some boundaries could be due to weak horizontal gradients
in-
Introduction
Fal estuary comprises a large number of different habitats and substrates making
it one of the most biologically-
Our aim was to gain an understanding of the habitat surveyed in the upper reaches of Fal estuary, using sidescan sonar and video footage in order to identify bedforms, species and sediment present.
Methods
A printed thermograph from the sidescan was coupled with information from the tow fish’s navigation to produce a habitat map. Video footage was used for data grounding instead of grabs as the sampling site was a (SAC). The frequencies used for the sidescan were 100kHz and 415kHz.
Poster.pdf
Date: 27/06/13
Vessel: MTS Vessel
Cloud cover: 3/8
Tides: High tide of 5m at 09:00 and low tide of 0.4m at 15:30.
Transect 1:
Start location: 50°10.915N 005°01.591W
End location: 50°11.553N 005°02.611W Start time(all times UTC): 09:27
End time: 09:38
Transect 2(initially transect 1):
Start location: 50°11.556N 005°02.545W
End location: 50°10.838N 005°01.531W Start time: 09:10, End time: 09:22
Transect 3:
Start location: 50°11.499N 005°02.688W
End location: 50°10.757N 005°01.494W Start time: 09:42, End time: 09:53
Transect 4:
Start location: 50°10.711N 005°01.559W
End location: 50°11.407N 005°02.737W Start time: 09:56, End time: 10:08
Transect 5:
Start location: 50°11.415N 005°02.807W
End location: 50°10.679N 005°01.589W Start time: 10:10, End time: 10:23
Video Feed 1:
Start location: 50°11.435N 005°02.331W
End location: 50°11.144N 005°02.077W Start time: 10:46, End time: 11:06
Video Feed 2:
Start location: 50°11.059N 005°02.130W
End location: 50°10.904N 005°02.133W Start time: 11:10, End time: 11:18
Geophysics
The views expressed above are those of the authors and not those of the University of Southampton or the National Oceanography Centre Southampton.