

|
|
|||||
|
|
|
Ferrybox Project | |||
|
|
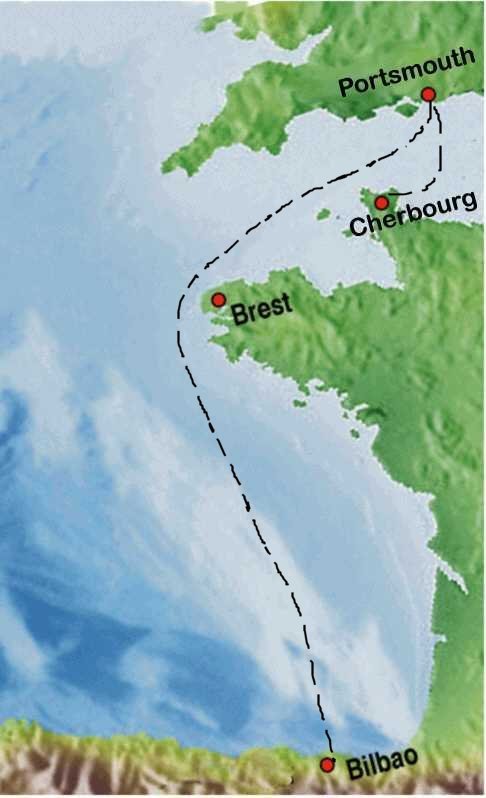
The FerryBox equipment was first fitted on the P&O Pride of Bilbao in April 2002. Since then data has been transmitted to NOC using the Orbcomm satellite system and displayed on this webpage in real time. (The graphs of data accumulated via the satellite in 2002, 2003 and 2004 are available through links on this page. When operating, the map below shows the latest received position of the "Pride of Bilbao". The graphs on the right show the data from the ferry that was collected over the real-time link in 2005 and now in 2006. In 2005 the system was installed on 29 January 2005 and operations continued until 3 January 2006, after a refit operations recommenced in late February. In 2002 the sensors for measuring Temperature, Conductivity, and Fluorescence were installed in the engine room P&O Pride of Bilbao. In 2005 extra sensors measuring turbidity, the concentration of dissolved oxygen and the partial pressure of carbon dioxide in sea water were fitted. Additionally sensors monitoring the movement of the ship were fitted. |
|||||
|
Sensors for measuring Temperature, Conductivity, and Fluorescence have been installed in the engine room of the ferry ship P&O Pride of Bilbao Data are received via a satellite link. 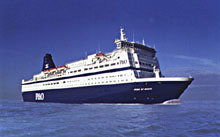
Dolphins and whales are often seen from the Pride of Bilbao. More information can be found by going to the BDRP website |
|
Click on a graph to see the full-size version.
Sea Temperature 2005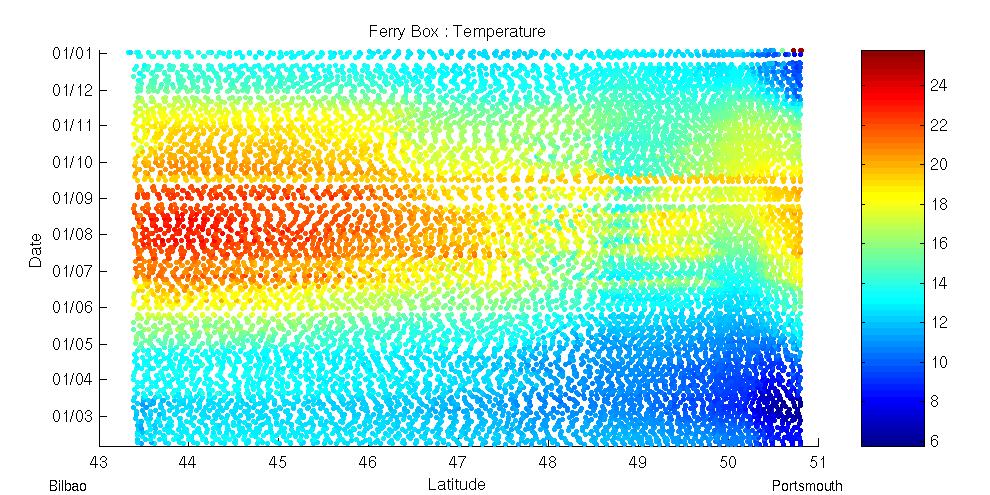
Fluorescence 2005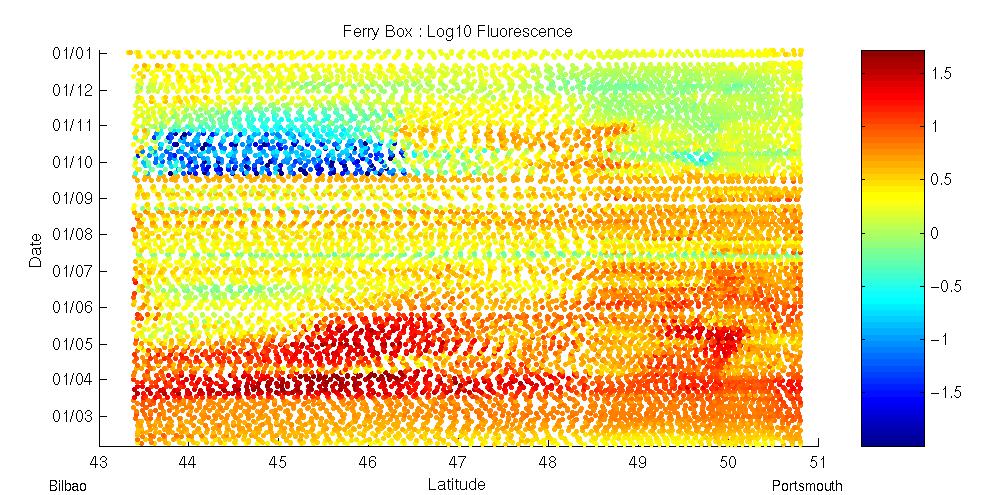
Salinity 2005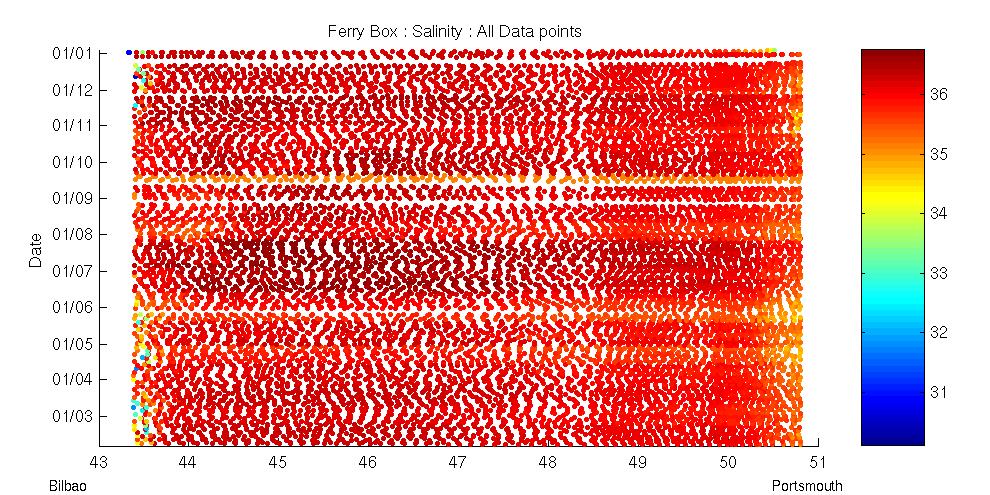
|
||||
New Sensors |
||
Pitch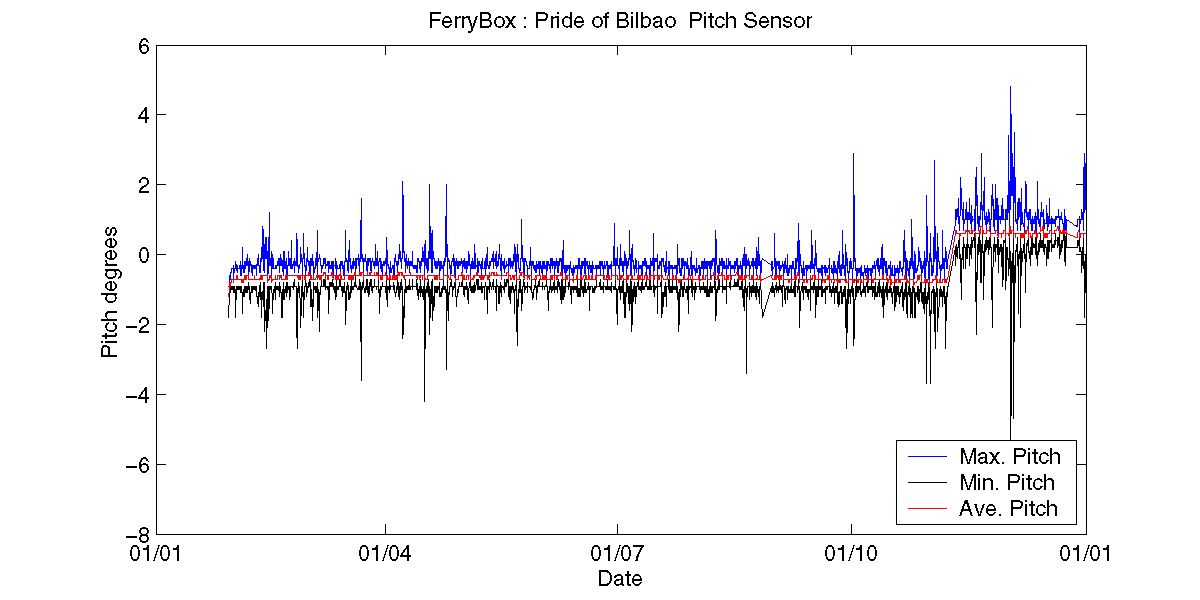
|
Roll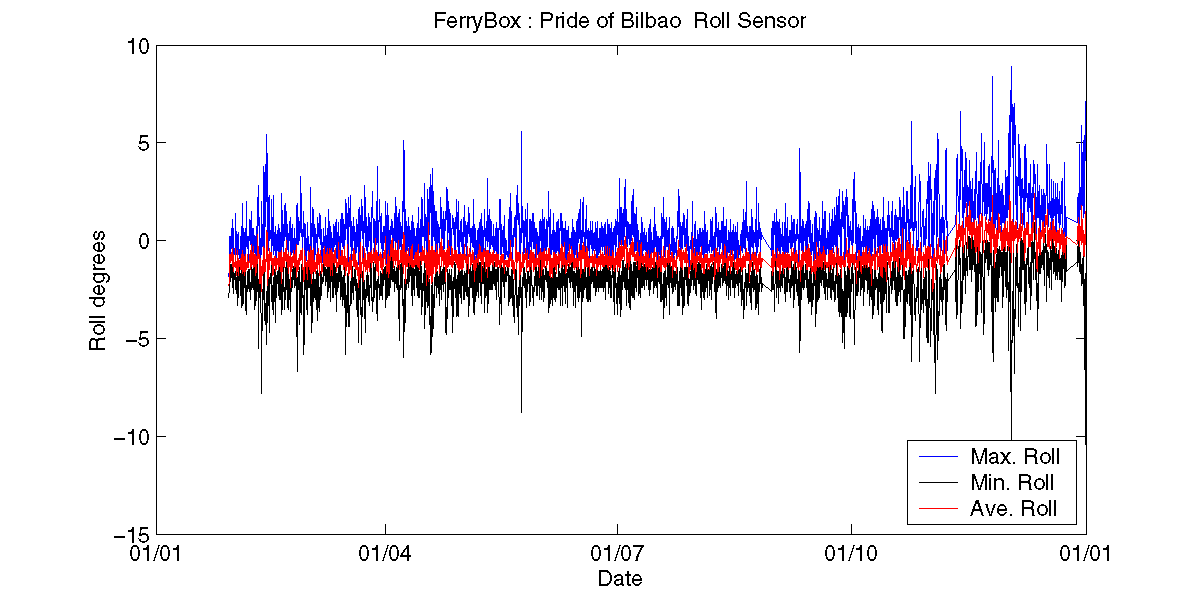
|
Oxygen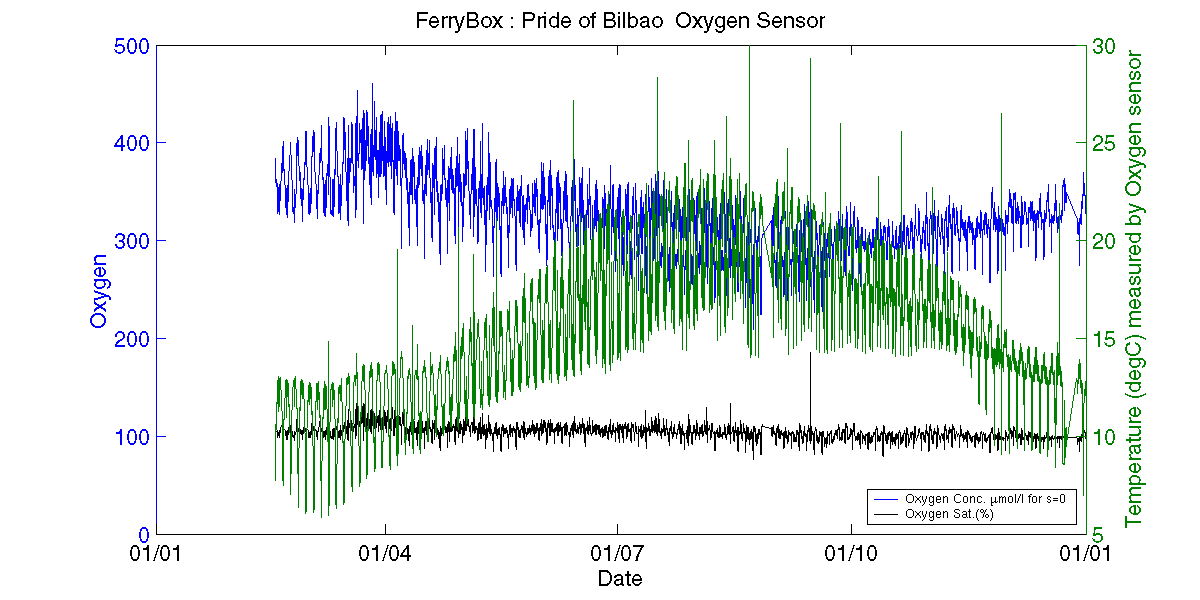
|
|
|
|
|
|
|
| Operational Project Home Page | | | NOC Home Page | | | Southampton University Home Page | | | NERC Home Page |
