![]() View
animation files directly or see full descriptions below
View
animation files directly or see full descriptions below
Click
here for an animation of the offshore bloom, May 2001
Click
here for an animation of the Southampton
Water bloom June 2001
Click
here for an animation of the salinity and chorophyll data with a
clock indicator of tidal range
![]() What
the animations show
What
the animations show
The data have been animated to assist in data interpretation. In each
of the diagrams
the amount of chlorophyll is indicated by a colour scale. This
ranges from low values
in the blue. The bloom takes off when chlorophyll levels are
in excess of 10 mg/m3
(the green range), peaking around 40 mg/m3 this year indicated
by red and pink colours.
The Red Falcon ferry makes up to 16 crossings each day between Town
Quay to the north
and Cowes to the south on the Isle of Wight (data every minute).
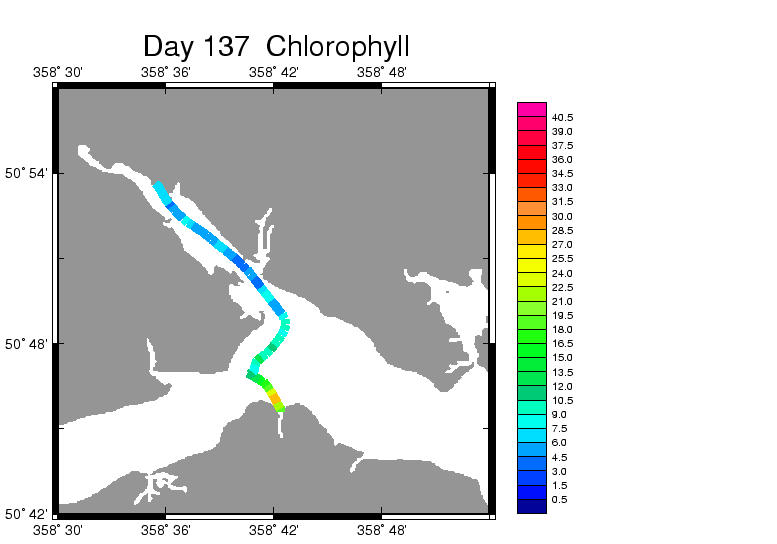
This plot is a single frame from the animation of the spatial distribution
of chlorophyll
along the ferry track. In this example high chlorophyll levels (seen
in orange) are found
offshore close to the Isle of Wight.
![]() Between
April and August of this year there were 2 main blooms associated with
neap tides.
Between
April and August of this year there were 2 main blooms associated with
neap tides.
Animation of the data obtained allows us to look at
the distribution of phytoplankton during
these two main blooms.
Development of the first bloom of diatoms in May can be followed from
one spring tide to
the next. Individual ferry tracks from day 129 (on the 9th May)
to day 145 (on the 25th May)
have been strung together and show the development of an offshore bloom.
Click here for an animation of the offshore bloom, May 2001
Low chlorophyll indicated
by blue colours increased into the green colours over the track of
the ferry. The
main activity is seen in the Solent. The chlorophyll levels peaked
(at over
30 mg/m3 indicated by orange
and red colours) on day 137, on the neap tide. The
chlorophyll levels remained
high but very patchy after the neap tide due to the large
slicks of phaeocystis which
were not broken up by the higher energy spring tides.
Another animation of the ferry tracks show the development of the phytoplankton
blooms in June from one spring tide on day 159 (8th June) to the next
on day 174
(23rd June). In this case the picture is clearer than the May bloom
as the chlorophyll
levels were low on each of the spring tides. The peak of the
bloom is on
the neap tide (day 167).
Click here for an animation of the Southampton Water bloom June 2001
This time the chlorophyll
levels increase in Southampton Water and remain low offshore.
Chlorophyll levels peaked
inshore, near Southampton, on the neap tide on day 167.
It is thought that low nutrient
levels in the higher salinity water limit development
of the bloom offshore.
![]() Chlorophyll
and salinity contours
Chlorophyll
and salinity contours
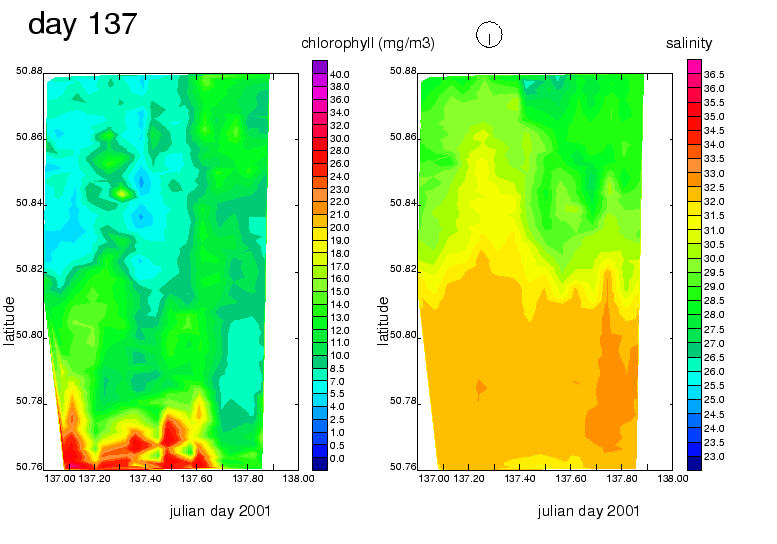
Contours of chlorophyll and salinity with respect to latitude can also
be produced
from the data. This allows us to look at the spatial distribution
of chlorophyll in
Southampton Water and the Solent with additional temporal information.
Tidal
information has been illustrated by a clock, it is largest (with hands
pointing to midnight) when the tidal range is largest (on a spring
tide).
Here the distribution of chlorophyll and salinity is shown on a neap
tide, day 137.
The clock size is small (the hands pointing to 6:30) indicating
a neap tide.
In this example the bloom is seen offshore with some indication of
high
chlorophyll being washed up Southampton Water with the high tide.
On the springs the tidal range is larger so the low salinity water
is seen spreading
further out into the Solent on the ebb tide. The chlorophyll
levels tended to be low
on the spring tide this year. This is in contrast to previous
years, however it is an
easier picture to interpret as we would not expect to see blooms associated
with
high energy spring tides.
On a spring tide high water is at midnight and midday, animation of
hese files show the change in tidal range and progression of the tide
as the
high salinity peak moves to the right. In many cases the chlorophyll
and
salinity can be correlated by close examination of these images.
![]() We
can string individual frames together to obtain an overall picture of
We
can string individual frames together to obtain an overall picture of
chlorophyll related to position, time and the tides
from day 115 (25th April)
to day 227 (15th August).
Click here for an animation of the salinity and chorophyll data with a clock indicator of tidal range
Salinity values increase
through the year. At the start of this animation
during a spring tide low
salinity and low chlorophyll values are seen.
After a short period of
missing data the chlorophyll concentrations
start to increase around
the spring tide on day 129 in May.
They continue to increase,
especially offshore, peaking on the neap tide on day 137.
After this time the chlorophyll
levels are high and patchy offshore. Around
day 154 at the start of
June the chlorophyll values are low again (on the spring tide).
After this time they increase
further north (in Southampton Water) and peak on day
167 (the 16th June), on
a neap tide.
Chlorophyll values decrease
towards the following spring tide increasing around
the neap tide (day 183 at
the start of July) although the chlorophyll concentrations
are halved compared with
the May and June blooms. On the following neap tides
on days 196 in July and
226in August chlorophyll levels remain low.
Further work is needed to link this with other factors such as the weather
and nutrient levels.
Back to Ferrybox page
NOCS Home Page
Page last updated by SUH 25 Sept 2001 (Pagnani 5-Dec-2008).