

GROUP
Plymouth Field Course 2019
4
Disclaimer: the views and opinions on this website are not necessarily expressed by The National Oceanography Centre or the University of Southampton. They are completely representative of the authors of this website.

Overview:
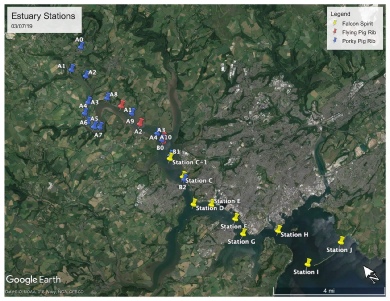
On the 10th July 2019, a complete survey was conducted of the Tamar estuary with Group 5 covering the upper estuary on the RIB boats - Porky Pig and the Flying Pig, and Group 4 covering from the Tavy confluence down to the breakwater in the Plymouth sound on a research vessel provided by the Plymouth Marine Laboratory (the RV Falcon Spirit).
Onboard the RIB boats, Group 5 had a Temperature/Salinity probe, a niskin bottle and a plankton net for sampling and the RV Falcon Spirit had a CTD, an ADCP and a plankton net. By combining the sets of data acquired from both groups, a full data was established to represent the Tamar estuary as a complete system.
On the RV Falcon Spirit, the CTD rosette was lowered from stations C-1 to J and used to record fluorescence, turbidity, temperature and salinity. The 6 niskin bottles attached to the rosette were used to obtain water samples to observe chlorophyll and oxygen concentrations as well as phosphate, nitrate and silicate.
An ADCP transect was taken to determine the flow speed and direction within the water column and provided an indication of the physical processes taking place within the estuary.
The zooplankton nets were 60cm in diameter with a mesh size of 120µm. In the upper estuary, the net was deployed at A0, A8 and B2 and in the lower estuary, at stations G6, H7 and I8. Seagrass had to be removed from a number of samples which probably originated from the mudflats of St. John’s Lake which is a Site of Special Scientific Interest (SSSI) [1]. Phytoplankton samples were taken from the water sample after the oxygen bottles had been filled.
Three nutrients - nitrate, phosphate and silicate, were all taken from the niskin samples. Three or four bottles were fired at each station; one at the surface, one at the seafloor and one/two in the water column. Nitrate and phosphate were processed in the lab through the auto-analyser whilst the absorbance for silicate was measured through a spectrometer. The Theoretical Dilution Lines (TDL) were constructed by connecting a straight line plot between the riverine endmember (lowest salinity) and the salt water endmember (highest salinity).
Methodology:
A front was observed at two different stations measured by the RV Falcon Spirit (Stations C-1 and D). This showed a clear vertical stratification of the estuarine water column caused by the interaction between the incoming seawater by tidal processes and the freshwater inputs of the River Tavy. This demonstrated the partially mixed estuarine structure.
Sections of seagrass were observed at Station G on the water surface indicating the presence of seagrass beds. These are incredibly productive ecosystems and provide stable habitats (by stabilising the sediment) for diverse marine communities.
Interesting features:
Map of data stations:

Meta data:
High tide - 07:00 UTC
Ebb tide - 09:10 UTC
Start time - 08:23 UTC
End time - 12:54
UTC
Click on map to enlarge