
Habitat Mapping
Aims and Objectives
The aim of this exercise is to produce a working habitat map of the area surveyed in Plymouth Sound.
Using side-
Side Scan Sonar
Although habitat maps are an important and valuable tool to many scientists and conservationists they receive relatively little funding due to the time consuming and expensive methodology. There are two main approaches to habitat mapping. Firstly a preliminary study could be conducted on a site that has not been mapped before, this method is called prospecting. These are the most costly and time consuming (often take up to a month or more) due to the level of detail required to produce a good quality baseline for the area. Secondly an area that has already been mapped can be revisited and new maps can be compared to older examples to see how the environment has changed. Ideally mapping would take place once a month in special interest zones. However, the seagrass beds in Plymouth sound which are protected haven’t been surveyed since 2012.
Methodology
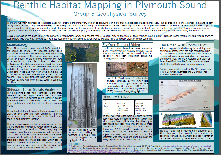
There are 3 major components to our habitat map. Side scan sonar is used to image
the sea bed, this is a multi-
In this practical samples were taken on the west side of Plymouth sound as it had not yet been mapped by students of other groups, and was likely a soft sediment environment based on instructors previous knowledge. 3 x 2km transects were taken 100m apart. As well as 2 grab samples using van Veen grab equipment and one video sample.


Top image shows the side-
Navigation
HYDROpro Navigation Software was used to plot the transect lines needed by the crew in order to conduct the side scan sonar survey. The coordinates for the survey location were decided using a chart and the Skipper’s mapping software. Once these coordinates were decided they had to be converted from Latitude and Longitude to Northings and Eastings. This is because the HYRDOpro Navigation Software doesn’t use Lat and Long; it requires a planar view, hence the need for a conversion from latitude and longitude. Below are converted coordinates of the start and end points of the transect in eastings and northings.
Start: 51,538.997m Northings, 246,393.057m Eastings
End: 50,520.513m Northings, 244,248.216m Eastings
Configuration settings for HYDROpro Navigation Software:
Configure -
There was an issue with the crew’s system due to 2 lines being plotted either side of the original line; one line was in an area of very shallow water. This created a complication on the skipper’s system, and hence one of the lines was omitted (line 7) from the transect.
X-
X-
X-
^ Visual representation of the lines plotted by HYRDOpro.
The transect begun on Gr3_06 (Line 6).

Click image to the left to enlarge
The views and opinions expressed are those of the individuals and not representative of the University of Southampton or the National Oceanography Centre