

University of Southampton OES Undergraduate Falmouth Field Course 2016 - Group 3 databank and initial findings.
Disclaimer: The views and opinions expressed are solely those of the contributors, they do not reflect the views and opinions of the University of Southampton.


Pontoon time series
Time series data is a useful tool for detecting physical, chemical or biological changes at a set location across the parameter of time. To detect changes in physical and biological parameters between 12:00 UTC and 15:00 UTC in the River Fal, instruments were deployed at 30 minute intervals with the aim of characterising the water column and its variation over time. The location for instrument deployment was a floating pontoon situated at 50˚12’58.0N, 005°01'39.5W The instruments deployed collected data for flow speed and direction, temperature, dissolved oxygen, pH, chlorophyll and irradiance at 0.5m depth intervals.

The following instruments were deployed from the pontoon in order to collect data relevant to the aim.
Exo-probe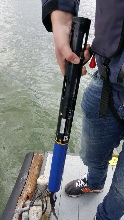
The EXO Probe was used to measure depth, temperature, salinity, pH, dissolved oxygen percentage and dissolved oxygen milligrams per litre. The Exo probe also measured the depth from the surface so as it was lowered through the water, accurate measurements could be recorded at specific depths. The salinity measurements were calibrated against the CTD on RV Conway, this calibration found that that the salinity readings were out by 12 psu, the salinity readings could then be corrected for this.
Flow meter
Every half an hour, the 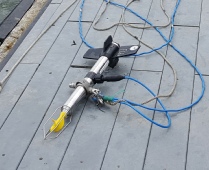 flow rate of the water passing the pontoon of measured at
different depths through the water column. A flow meter was lowered off the side
of the pontoon and the values of current speed (m/s) and direction (degrees from
North) were recorded at half meter intervals. The first measurement was always taken
at the surface, with the current meter held just below the surface. The flow metre
continued to be gently lowered through the water column until slack was felt on the
rope, signalling maximum depth. The last measurement was recorded at the last full
metre or half metre before maximum depth, i.e. if the water was 4.25m deep, the last
measurement was taken at 4.00m.
flow rate of the water passing the pontoon of measured at
different depths through the water column. A flow meter was lowered off the side
of the pontoon and the values of current speed (m/s) and direction (degrees from
North) were recorded at half meter intervals. The first measurement was always taken
at the surface, with the current meter held just below the surface. The flow metre
continued to be gently lowered through the water column until slack was felt on the
rope, signalling maximum depth. The last measurement was recorded at the last full
metre or half metre before maximum depth, i.e. if the water was 4.25m deep, the last
measurement was taken at 4.00m.
Light meter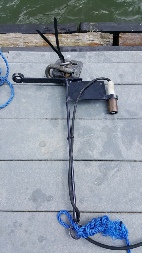
The light meter was lowered on a rope with depth markers and measured local irradiance. This was then calibrated with the help of measurements from a surface light sensor and converted into percentage surface-in-air irradiance values.
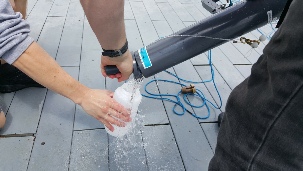
Niskin bottle
The Niskin bottle was used to collect water samples from the water column at discrete depths and bring them to the surface for analysis. To achieve this, the Niskin bottle was connected to a rope with set depth marks and lowered to 0.5m depth increments from 0.5m to approx. 3m. A messenger was deployed along the rope once the Niskin bottle was at the required depth in order to close the bottle and contain a water sample. Once returned to the surface, 50ml of water sample was forced through a filter paper in order to collect phytoplanktonic organisms from the water sample. This filter paper was further placed in acetone to dissolve the organisms and present Chlorophyll. This method was limited by strong tidal currents, which resulted in the Niskin bottle being deflected once entering the water column. As the length of rope deployed was used as a means of measuring depth, the deflection of the rope from vertical could have resulted in erroneous depths being ascertained, and further, collection of water samples from incorrect depths.
Limitations of methods
Due to metre marks being used on the rope, taking measurements at some intervals was also complicated by having to use perception to judge points between marks. This could have resulted to human error in taking samples at some depths. Additionally, the ebb current was very strong during the time series which might result in slanting of the ropes while lowering the equipment resulting in inaccurate depth measurements.
Methodology
Navigate to Observations