![]()
Oceanography Field Course
Falmouth, July 2006
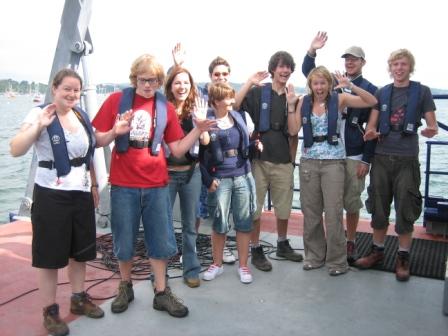
GROUP 9
|
Katie, Esben, Emma, Lydia, Matt, Chris, Sophie, Jordan, Graham |
![]()
|
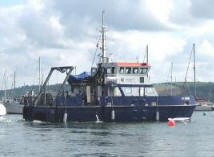
6th July - Offshore Investigation into the properties of the offshore water column and its associated biology using the Callista |
Click on the map to navigate to different sections
of the site
|
|
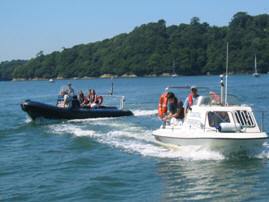
9th July - Estuarine RIBs Study of the salinity gradient and the nutrient distribution in the upper estuary and their effect on the biology |
|
|
13th July - Geophysics Determine the substrate type, bedforms and associated biology of an area in the Fal estuary using side scan sonar and grabs. |
|
|
16th July - Bill Conway Determine the water flux through the Fal estuary using ADCP and CTD transects and the effect the chemical structure has on the plankton communities. |
![]()
![]() INTRODUCTION
INTRODUCTION![]()
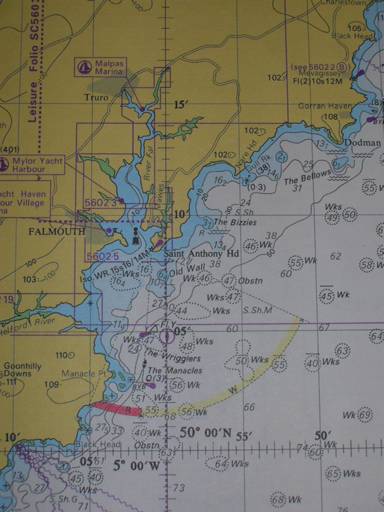
The Fal estuary is situated on the South coast of West of Cornwall and is characterised by its important naturally deep harbour. The estuary is a deeply incised river valley which has been drowned by rising sea levels making it the third deepest natural harbour in the world. The Fal River is approximately 29km long and is tidal for a distance of 18 km inland and has a shoreline totalling 115 km in length.
The aim of the Falmouth field course was to study the Fal River, its estuary and the surrounding coastal area. Of particular interest are the transitional zones between fresh and salt water masses, the development of a seasonal thermocline and the processes that affect these characterstics. Over a 14 day period from the 3rd to the 14th of July data was collected to give an insight into the biological, chemical and physical aspects of the estuary and offshore areas. Water samples were collected from the upper reaches of the Fal estuary through to the English Channel to a depth of around 70m, this involve estuarine, reverie and offshore environments. A geophysical survey of the area was also undertaken.
![]()
|
OBJECTIVES: |
To undertake an investigation into the development of a thermocline and its location in the water column. Specifically how it effects the stratification of biological and chemical aspects of the offshore region. This will include studying variety of parameters from Black Rock at the head of Falmouth Estuary into the English Channel using CTD casts, water samples, plankton trawls, secchi disk measurements and ADCP profiles at various stations. |
 |
|
The figures below show physical, chemical and biological data (click to enlarge) |
|
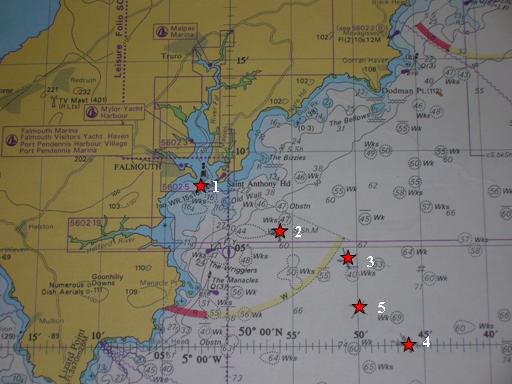
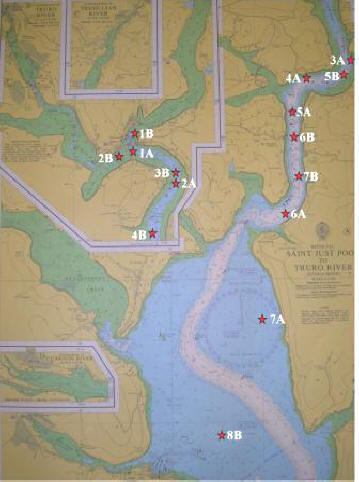
1 - Station 1 Black Rock 50'08.514N 005'01.653 W (9:03 GMT 2 - 50'06.548N 004'57.815W (10:49 GMT) 3 - 50'04.622N 004'54.371W (11:34 GMT) 4 - 50'00.406N 004'48.215W (12:20 GMT) 5 - 50'00.406N 004'48.215W (12:20 GMT) |
|
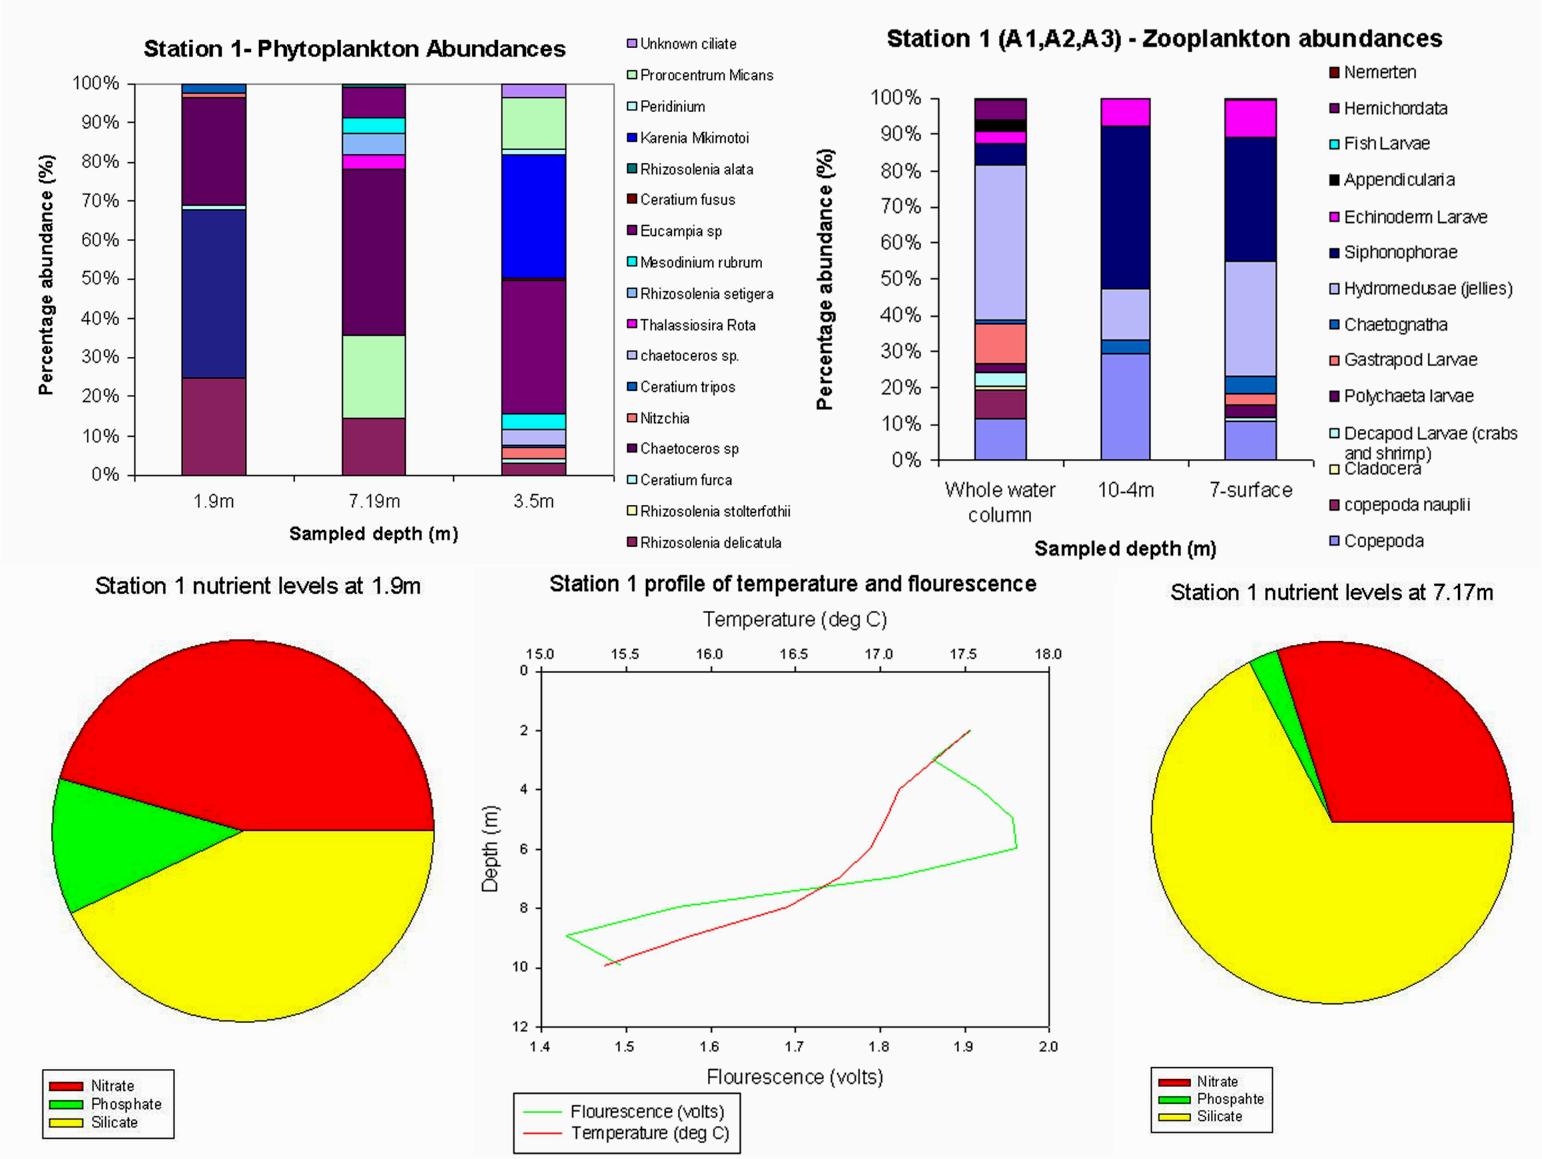
Station 1: 50'08.514N 005'01.653 W (9:03 GMT)
|
The physical conditions at station one show a well mixed water column that is reflected by several of the measured parameters including gradually decreasing temperature with depth and the fluorimetry profile showing a small peak at 7m. Biologically, diatoms (Rhizosolenia stolterfothii) are most dominant phytoplankton at this station both in the surface waters and the small flourimetry maximum. The nutrient showing much higher silicon levels especially at the peak are most likely fuelling this bloom. The most abundant zooplankton species is Siphonophorae spp. and is situated near the chlorophyll maximum. (click image to the left to enlarge) |
Example of a Siphonophorae, the dominant zooplankton species at station 1 |
|
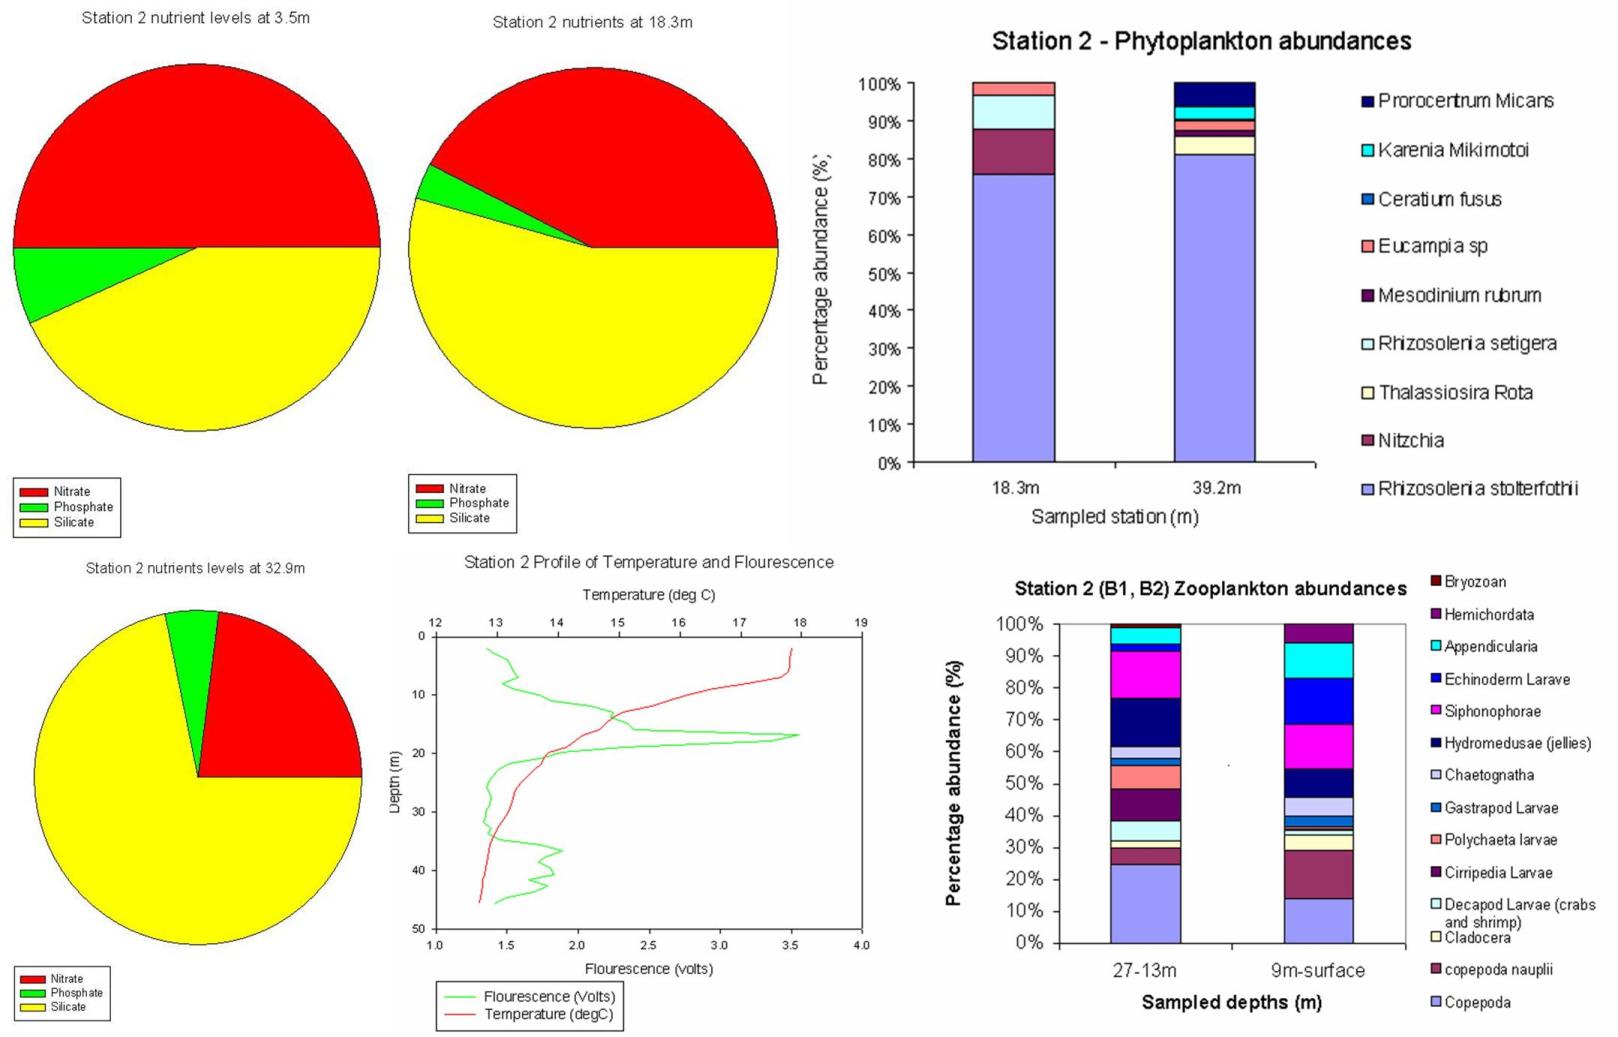
Station 2: 50'06.548N 004'57.815W (10:49 GMT)
|
Station two structure shows the water column before the development of a full seasonal thermocline. There is a gradual temperature gradient between 10 and 30 meters. At this site there are 2 peaks in fluorescence; one at 20m and one at 40m implying two peaks in phytoplankton. The dominant species was the same at both peaks and was the diatom Rhizosolenia stolterfothii. Nitrate decreases with depth where as silicate increases backing up the observation of high diatom levels. Copepods dominate the zooplankton species and Copepod nauplii are more common in the surface waters. (click image to the left to enlarge) |
|
|
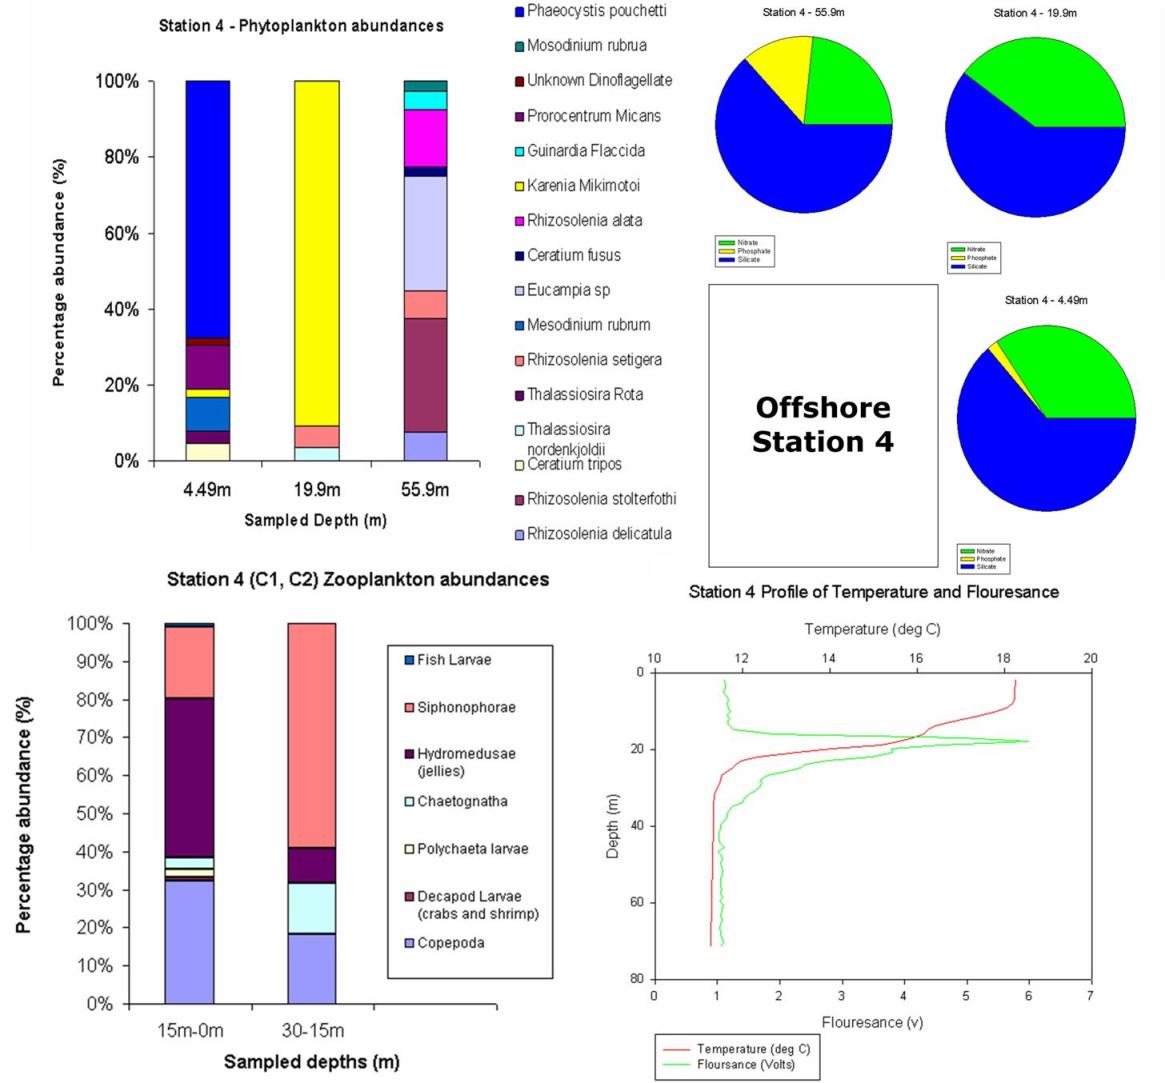
Station 4: 50'00.406N 004'48.215W (12:20 GMT) |
Station 4, offshore in the English channel, shows slightly different conditions. There is a fully developed thermocline at 20m implying two layers, each one being well mixed vertically. Silicon levels are significantly higher than the rest of the nutrients through out the water column. Phosphate in particular is very low at 20m this is probably due to high productivity at this depth. The corresponding peak in fluorescence at the thermocline is inline with the chlorophyll maximum and is made of predominantly diatoms (Karenia mikimotoi) where as at the surface flagellates (Phaeocystis pouchetti) are more common. The zooplankton biology shows Siphonophorae spp. dominating the surface water with hydromedusae present deeper down. (click image to the left to enlarge)
|
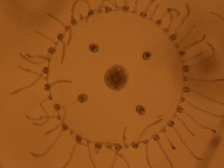
Example of the hydromedusae species found in the deeper water at station 4. |
|
Average backscatter between station 1 & station 2 |
ADCP Interestingly, the ADCP data failed to show a back scatter maximum at the same depth as the fluorimetry maximum on the CTD profile. A fluorimetry maximum indicates a high concentration of phytoplankton. Where there is high levels of phytoplankton, zooplankton flourish. Zooplankton are large enough to scatter the acoustics on the ADCP and therefore high backscatter levels would be expected where they are present however this was not observed. (click image to the left to enlarge)
|
|
|
CONCLUSIONS: |
Physically the conditions offshore of Falmouth develop as expected, from well mixed to fully stratified. Diatoms appear to dominate the chlorophyll maximum but fully offshore flagellates are becoming more abundant as the phytoplankton cycle progresses due to decreased mixing. Close to the estuary nitrate levels are higher in the surface waters where as further offshore the % silicate increase. Zooplankton are clearly present at all stations concentrated at the phytoplankton peaks. However the ADCP data does not show increased backscatter at these fluorescence peaks. |
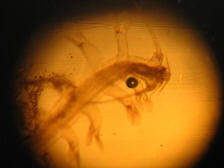
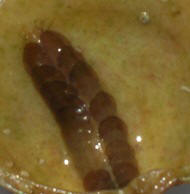
Planktonic polychaete larvae sampled offshore. |
![]()
|
OBJECTIVES: |
To survey the Fal River from Malpas Point to Mylor Harbour, using a multiprobe to measure (depth, temperature, salinity), water samples, plankton trawls and secchi disk measurements were also taken at each station. |
 |
|
|
1A:Malpas Point. 1B:Tresillian River 2A:Truro River 2B:Lambe Creek 3A:Ruan Creek 3B:Truro River 4A:Smugglers Cottage 4B:Level with Church Creek 5A:North of King Harry Passage (Vehicle Chain Ferry) 5B:Between Ruan Creek and Smugglers Cottage 6A:North of Tolcarne Creek 6B:Northern Area of Mussel beds 7A:Water Skiing Area 7B:Southern Area of Mussel beds 8B: East of Mylor Pool |
![]()
|
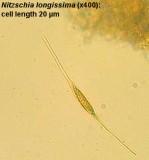
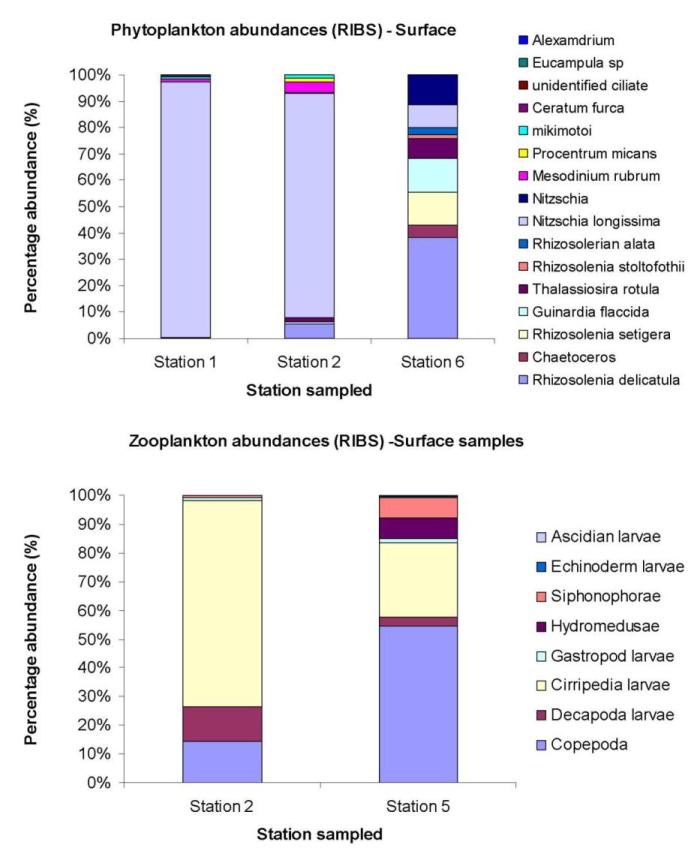
Phytoplankton: Estuarine phytoplankton analysis show that the populations of phytoplankton inhabiting the estuary vary in species composition markedly from the head to the mouth. At station 1 (50’14.823N 005’01.265W) in the upper regions of the Fal estuary the dominant phytoplankton species found was Nitzschia longissima a diatiom. A small percentage of ciliates and other diatoms are also present. Station 2 (50’14.415N 005’00.848W) shows a similar composition to station 1. However there is a significant decrease in the population of Nitzschia longissima. As a result of this, there are higher numbers of other diatom species. Station 6 (50’13.098N 005’01.609W) again follows the trend of decreasing numbers of Nitzschia longissima and increasing levels of other diatom species. Zooplankton: Only two zooplankton trawls were taken in the upper estuary. One trawl at Malpas Point and one further down the estuary at the mussel beds. At Malpas Point the most dominant zooplankton species appears to be of Cirripedia larvae (barnacles). This is not unusual as barnacle larvae are often found in inter-tidal regions and in colonies. Although our sample had high numbers of barnacles this could also be due to patchiness, not all the upper estuary will be dominated by barnacle larvae. At higher salinities copepods are more dominant as they are primarily a marine species. This was clarified by our zooplankton trawl next to the mussel beds, which had higher salinities.
|
Nitzschia longissima
Plankton Abundance (click to enlarge) |
|
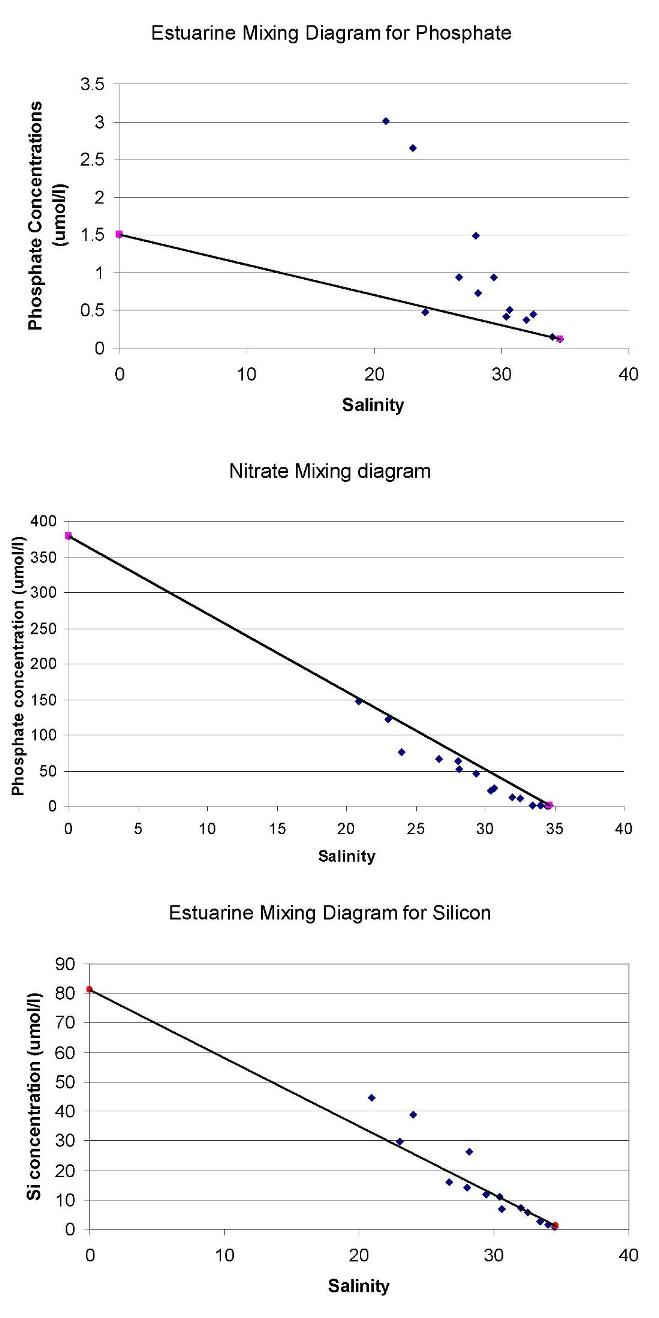
Estuarine Mixing Diagrams: The nutrient samples for these estuarine mixing diagrams were taken on a flooding tide. Nitrate: Nitrate in the upper Fal estuary shows conservative behavior. This implies that no nitrate is added or removed from the estuarine system or both addition and removal occur at the same rate.. Phosphate: Phosphate shows a non conservative trend. There appears to be a source of phosphate at roughly salinity 25. Phosphate is added to the system because of sewage treatment works at Malpas. 26 – 62% of the phosphate in the Fal estuary is thought to be due to sewage treatment works and between 3-49% is thought to be due to agricultural sources in the region (Langston et al, 2003) Silicate: Silicate in the upper Fal estuary shows conservative behavior. This implies no addition of silicate to the estuarine system or both removal and addition occur at the same rate.
|
Estuarine Mixing (click to enlarge) |
|
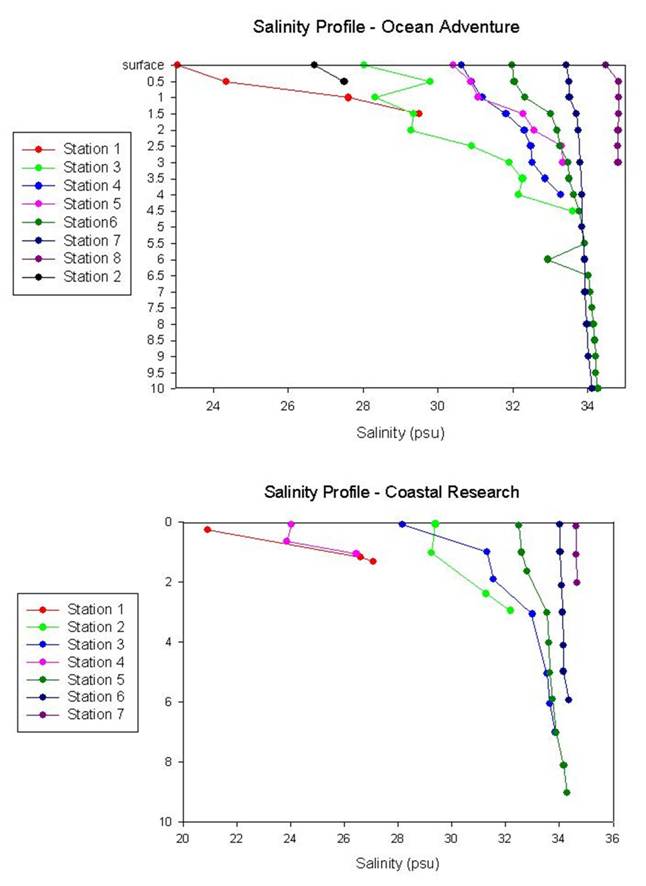
Salinity: Data from the Ocean Adventure was collected starting at Malpas Point, progressing up Lambe Creek and eventually heading down the estuary past the mussel beds towards Mylor Harbour (50’10.951N, 005’02.473W). The first station at Malpas Point, although only 1.5m in depth shows a significant change in salinity. In the surface waters there is a low salinity of 23psu, this is due to the high input of freshwater from the river and also from an increase in rain water input as there was a period of persistent rain in the days leading up to the sampling. Station 2, which is shown on the graph, displays a limited depth due to this position being located up Lambe Creek during low tide. As the vessel progressed towards the sea the salinity gradient down the water column becomes less distinct. At station 7 there is very little difference between the salinity of the surface water and the water at depth, indicating that the water column here is well mixed. The Coastal Research vessel started sampling in the Tresillian River and headed down the estuary, at station 4 the vessel headed up the Ruan Creek. It then continued down the estuary past the mussel beds finishing at 50’11.716N, 005’02.007W. The salinity profile shows a similar structure as the Ocean Adventure vessel with the water column becoming increasingly mixed and more saline as we approached the mouth of the estuary. Both salinity profiles show that the Fal estuary is well mixed. In the upper reaches of the estuary at low tide in Lambe Creek and the Tressilian River there is a distinct fresher surface layer.
|
Salinity Profiles (click to enlarge) |
|
CONCLUSIONS: |
The initial findings from the rib data suggests that physically the estuary is well mixed. Nutrients show both conservative, nitrate and silicate, and non-conservative, phosphate, behaviour. Interestingly diatoms appear to dominate in the upper estuary, this would suggest silicon removal for test formation. However the estuarine mixing diagram shows conservative behaviour of silicon. This may suggest that there is a source of silicon equal to the diatom silica sink. The large concentration of barnacle larvae in the upper estuary suggests there is a high proportion of hard substrate and rocky outcrop due to the hard surface barnacles require to settle and live on. |
![]()
|
OBJECTIVES: |
To better understand the transition between the upper reaches of the estuary and the offshore zone by investigating the biological, chemical and physical processes that are characteristic in the lower reaches of the Fal Estuary. The survey will involve taking CTD profiles, secchi disk measurements, ADCP profiles, water samples and zooplankton trawls, with specific interest in riverine flux and other inputs. |
|
|
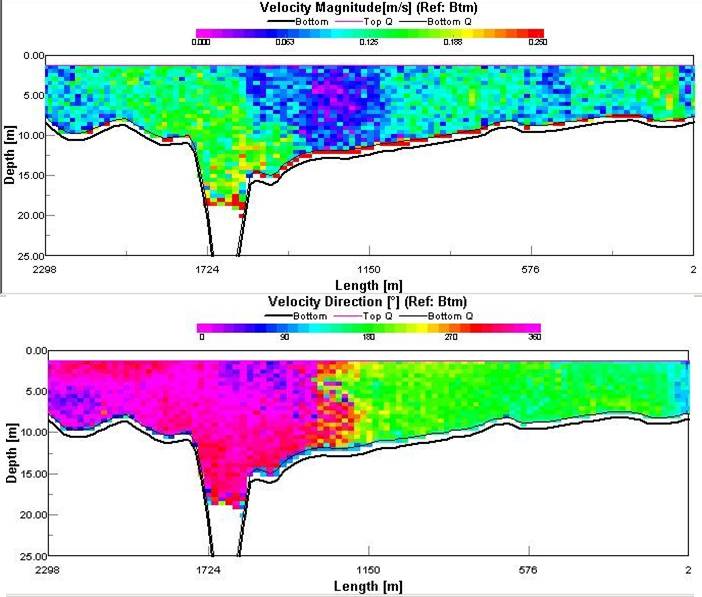
ADCP transect 1 Start: 08:44:36 GMT Finish: 09:01:30 GMT Start location 50'09.364N, 05'02.949W Finish location 50'08.920N, 05'01.143W (click to enlarge)
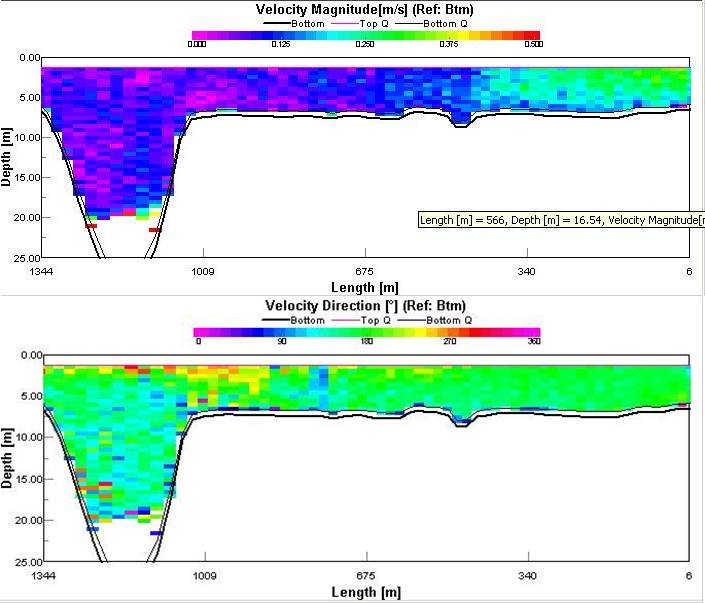
ADCP transect 2 Start: 10:03:40GMT Finish: 10:14:20GMT Start location 50'10.459N, 05'02.526W Finish location 50'10.886N, 05'01.578W
(click to enlarge)
|
ADCP: Transect 1, taken near the mouth of the Falmouth estuary, shows two areas of distinctly separate velocity directions. The duration of transect lasted from 15 minutes to high tide to 1 minute past high tide. On the eastern side of the channel the flow is heading northwards at a speed of 0.15 m/s, and contrasting this, the flow on the western side is heading southwards with approximately the same flow velocity. Towards the centre the flow is slower, with an approximate velocity of 0.05 m/s, and the direction of flow is less clear. This is due to the formation of eddies created by the incoming tide forcing the water into a confined area, whereby some of the water is forced back out towards the mouth in the shallower part of the estuary. In the centre the water is thus flowing irregularly and at a significantly reduced velocity.
Transect 2, taken immediately after high tide, just north of Transect 1, shows that the flow in the eastern, deeper side of the channel has slowed to between 0 m/s and 0.125 m/s, due to it being slack water at the time. On the western, shallow side the water is moving faster, with a velocity between 0.25 m/s to 0.375 m/s. The ADCP transect shows that the velocity direction is mainly 100 degrees in the eastern side, indicating the water is turning southward to flow out, and 180 degrees in the western side, heading south and out of the mouth. Over the western ridge of the deep channel the water is heading southwest into the faster outgoing flow of the shallow western side of the channel.
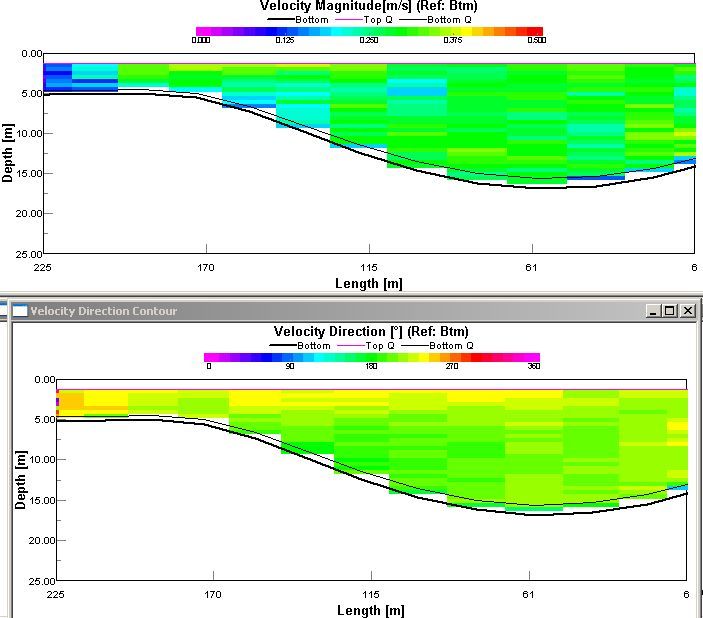
Transect 4 was carried out between the Pill Plantation and Turnaware Point, where the River Fal empties into the estuary. The transect shows that the flow in the deeper channel is heading southwards at a speeds of 0.25 m/s to 0.375 m/s. An interesting feature of this ADCP transect can be seen on the shallow eastern bank. Here the velocity is slower than in the deep channel, and the direction of flow is southward and slightly to the west, due to the shallower water being forced into the deeper part of the channel. There is also a shallow layer above the deeper section where the water is heading south south-west, flowing over the deeper and faster water in the main channel. This is probably due to the water not having accelerated with the main flow. |
ADCP transect 4 Start: 10.56 GMT Finish: 10:59 GMT Start location 50'12.261N, 05'02.310W Finish location 50'21.252N, 05'02.170W (click to enlarge) |
|
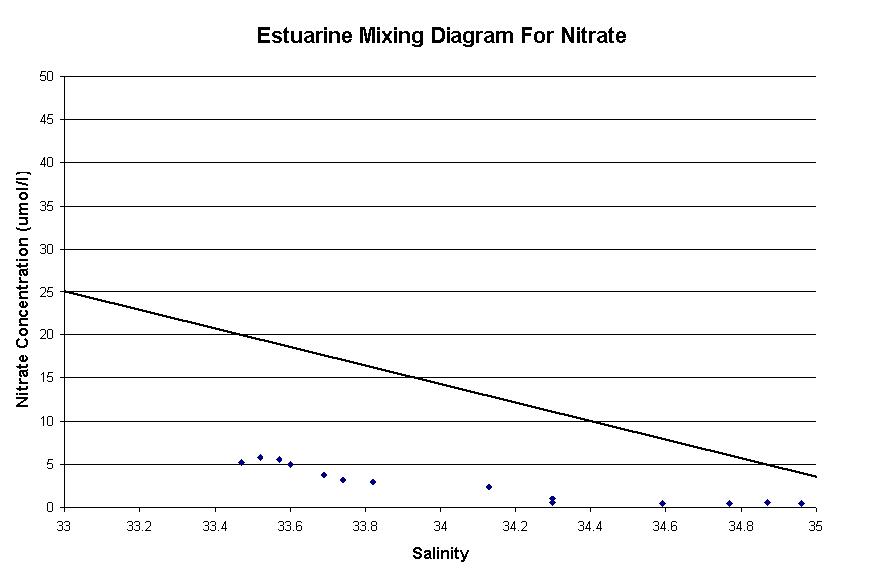
Estuarine mixing diagram for nitrate
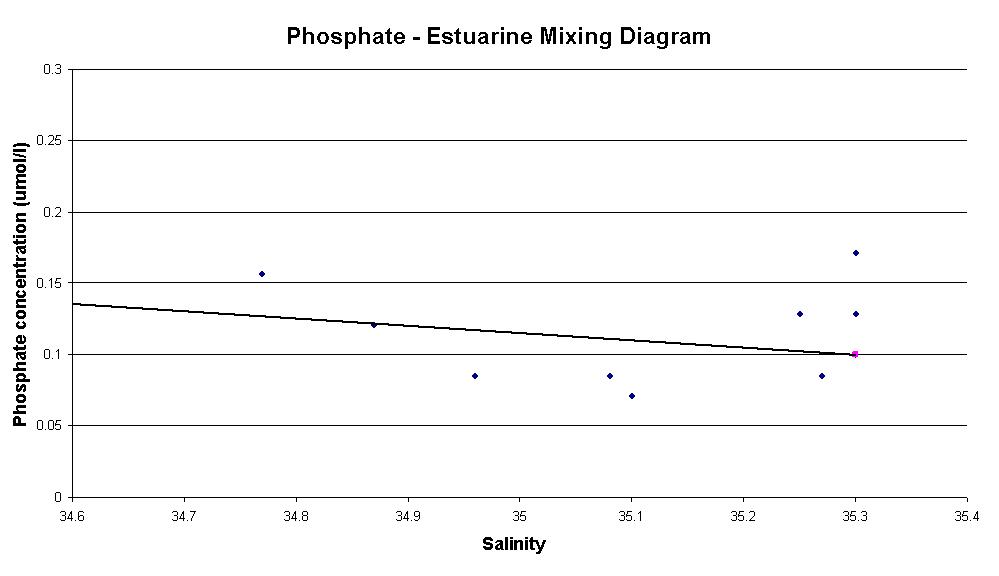
Estuarine mixing diagram for phosphate
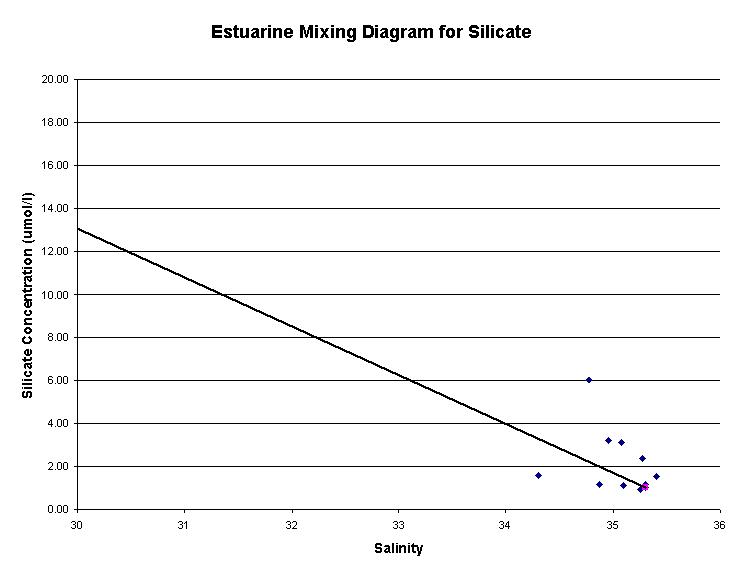
Estuarine mixing diagram for silicate
|
Mixing: Nitrate shows non conservative behaviour as it is
removed from the estuarine system. This is likely to be caused by high
biological activity further upstream stripping the nitrate out of the
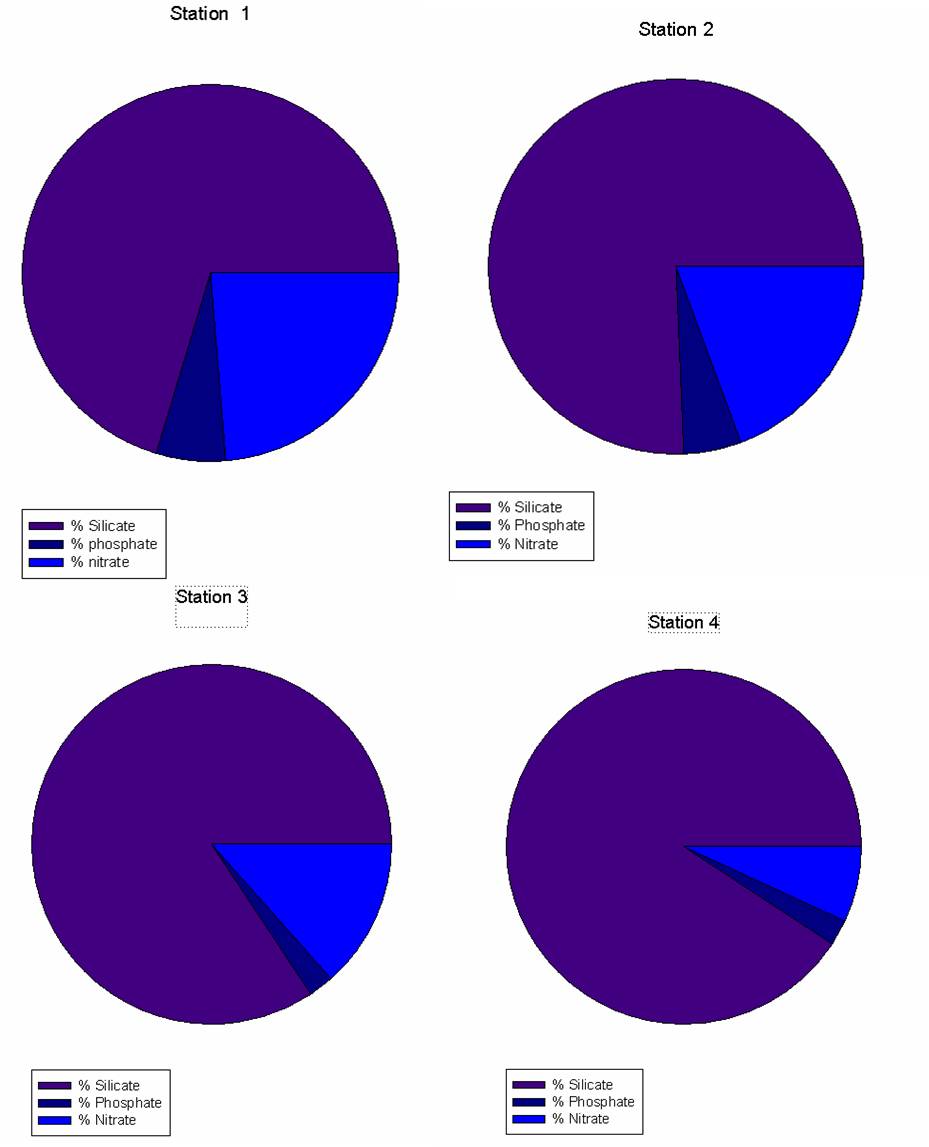
water column. (click to enlarge the thumbnails) Nutrients: At all stations Silicate has the highest % concentration. As expected phosphate is the least abundant nutrient present in surface layers with nitrates in the middle. As you progress seaward dissolved silicon decreases gradually. This is most likely due to the stations nearer the head of the estuary are more influenced by riverine inputs. This may input more silicon into the surface waters of the estuary. Nitrates present in the surface waters show evidence of a gradual increase as you head towards more saline water at the mouth of the estuary. This backs up the data in the estuarine mixing diagram for nitrates shows conservative behaviour.
|
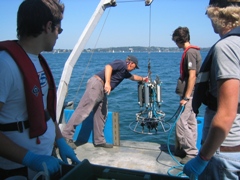
Chris helping to cast the Niskin bottle rosette with attached CTD
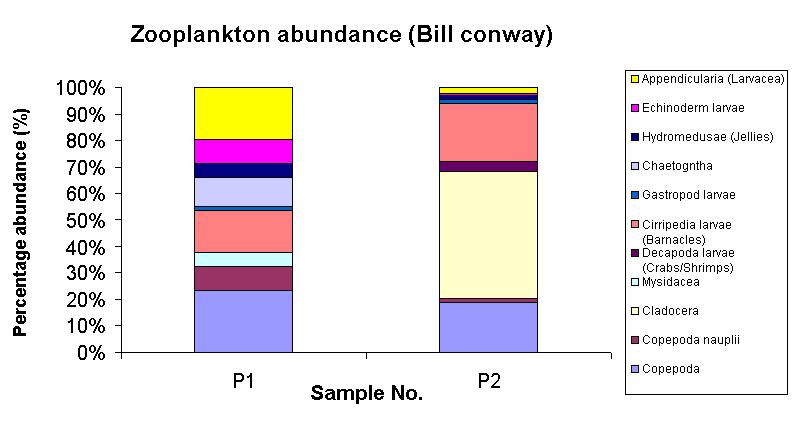
Pie charts showing nutrient abundance at four surface sample stations |
|
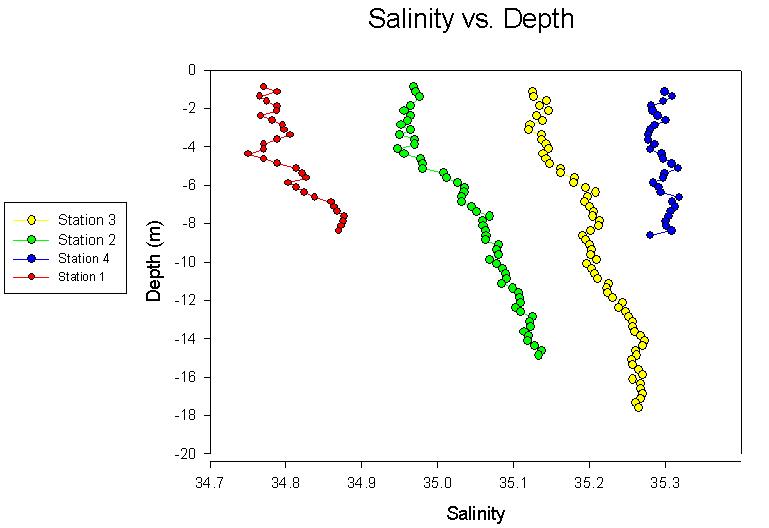
Salinity depth profile of the lower Fal estuary
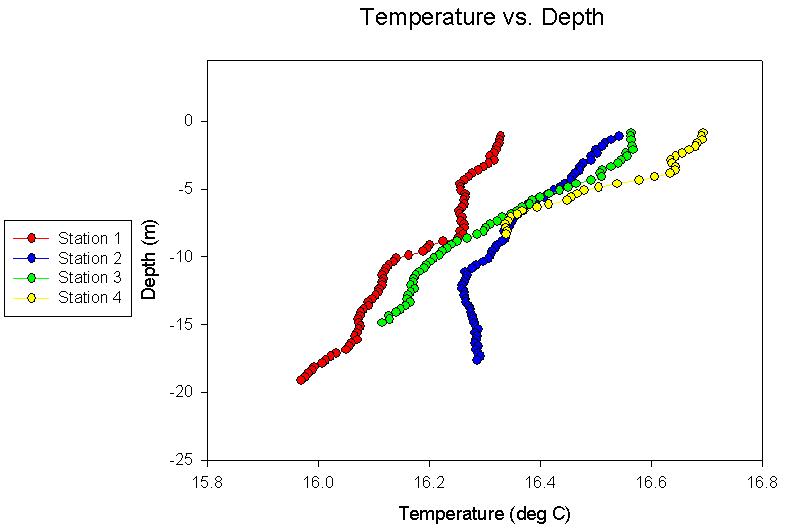
Temperature depth profile of the lower Fal estuary |
CTD: The temperature decreases from slightly higher temperatures in the surface waters to lower deeper down there does not appear to be a thermocline present. However the range from the surface to depth is very small. In general the temperatures nearer the mouth of the estuary eg. station 1 are colder than the ones further up estuary. This is as expected as the weather has been hot and sunny warming up the small volumes of the rivers faster than the larger open sea. Similar to the temperature range in the water column the range between stations is small too. Salinity down through the water column is fairly constant. The water at the surface is slightly less saline than the deep water but there is no obvious pycnocline. This implies that the estuary is well mixed. As expected the salinity decreases as you head upstream from station 1. These trends are illustrated in the two profiles to the left. (click to enlarge the thumbnails)
|
|
|
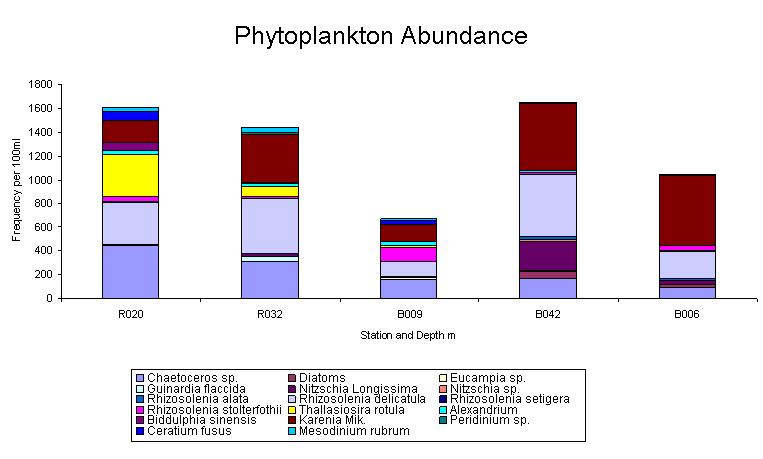
Phytoplankton abundance in the lower Fal estuary
|
Plankton communities: Water sample ‘P1’ was sampled in the surface layers of station 1. This sample site was dominated by Copepods and Appendicularia (Larvacea). This is surprising, as from what we have seen, the domination of copepods in the surface waters is unusual. Water sample ‘P2’ was taken in the surface layers of station 4. This sample was dominated by Cladocera. (click to resize thumbnails on left and right) |
Zooplankton abundance in the lower Fal estuary |
|
CONCLUSIONS |
Physically the estuary appears to be well mixed, the salinity profiles show a constant salinity value throughout a profile of the water column at all stations. On the small area studied the temperature doesn’t vary much this is not unusual as the weather has been hot and sunny evenly warming up this small area of the Fal estuary Nutrients show both conservative and non conservative behaviour. Generally this is explained by the plankton biology. High abundance of plankton would utilise many of the nutrients in the water column. This is shown in the non conservative behaviour of nitrate. The ADCP clearly shows the tidal currents for this area of the estuary during the turning of the tide from flooding to ebbing. Eddies are apparent as well as currents forced by the bathymetry of the estuary bed. |
|
![]()
|
OBJECTIVES: |
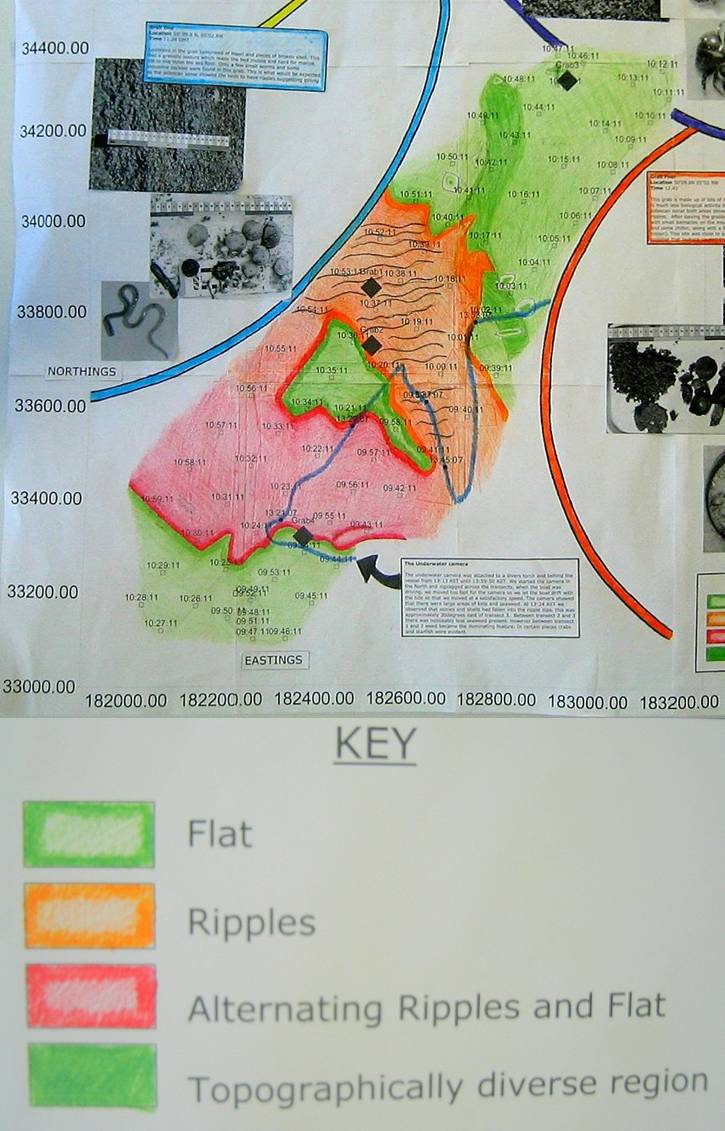
To survey 5 transect lines in an area of the estuary next to the Fal docks using side scan sonar and to take grabs of sediment to determine biology associated with the varying substrates. An underwater camera will be used to clarify the predicted bedforms and substrate. |
|
 GRAB 1: |
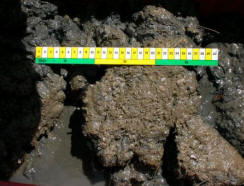
Grab One Location 50’ 09.9 N, 05’02.8W Time 11.24 GMT Sediment in the grab comprised of Maerl and pieces of broken shell. This had a gravelly texture which made the bed mobile and hard for marine life to live in/on the sea floor. Only a few small worms and some estuarine cockles were found in this grab. This is what would be expected as the sidescan sonar showed the beds to have ripples suggesting strong waves.
|
|
 GRAB 2: |
Grab Two Location 50’ 09.8 N, 05’02.8W Time 11.42 Maerl and broken shells also make up the sediment found in this grab with some finer grains with depth. The texture of this sediment was stickier than the first grab possibly due to a higher proportion of clay or by excretions by organisms living in the sediment. This made the bed less mobile and allowed a higher number of organisms to live in the bed. Here we saw hermit crabs, shells, crabs, some small shrimps and Noodle weed.
|
|
 GRAB 3: |
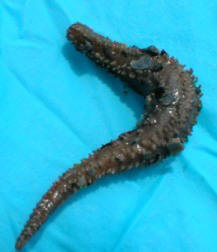
Grab Three Location 50’10.2N, 05’02.5W Time 12.12GMT This grab consisted of muddy sediment. There was a 2mm thick oxygenated layer and below this the sediment is anoxic. This suggests that there is very little life living in the sediment. After sieving the sediment we found one sea cucumber a few small worms and some pieces of broken rock, but most of the sediment was fine clay.
|
|
 GRAB 4 |
Grab Four Location 50’09.6N 05’02.9W Time 12.41 This grab is made up of lots of maerl with some broken shell. There is much less biological activity than grab 2, even though on the sidescan sonar both areas showed the same bedforms – no wave ripples. After sieving the grabbed material we found a few shells with small barnacles on the inside of them, a piece of a worm cast, and a scale worm, along with a few pieces of living maerl (pinky in colour). This site was close to a boundary with ripples so it is possible that layback caused the grab to hit this area instead.
|
|
Background to the substrate - Maerl: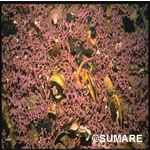
Maerl is calcified red seaweed that grows as unattached nodules on the seabed and forms extensive beds in favourable conditions. Maerl is slow-growing, but over long periods its dead calcareous skeleton can accumulate into deep deposits. Healthy pink maerl overlays the accumulated deposit. Maerl is typically found in areas with tidal flow, such as the narrows and rapids of sea lochs, or the straits and sounds between islands. Beds also develop in open areas where wave action is sufficient to remove fine sediments, but not strong enough to break the brittle maerl branches. Live mearl is found in shallow water, above 20 meters and extending up to the low tide level.
|
||
|
CONCLUSIONS:
small holothurian from sample grab 3. |
The sediment type and biology in the Fal Estuary near Falmouth Docks show a few key environments. The deep water showed a small oxidized layer of less than 5mm followed by a deeper anoxic layer with. The substrate itself showed no obvious surface features and biologically there is very little, just small holothurians (sea cucumbers) and polychaetes. From the side scan, in the shallow areas there are three main bedforms: mega-ripples, alternating flat and mega-rippled, and flat substrate. The rippled areas show linear and bifurcating ripples at 1m wave length. These form as a result of wave energy over shallow depths rather than tidal flow strength. The biology is consistent with this environment. Cockles are in abundance, these species flourish in and around a mobile environment like the dead maerl that make up this sediment. The flat areas show increased biodiversity due to the more seaweed present keeping the sediment stable or the more stable cohesive sediment allowing for the growth of the seaweed. The underwater camera clarifies these observations, showing clearly defined bands of shells and seaweed which collect and grow in the depressions between the ripple peak |
Image of geophysical transect map showing main bedforms (click to enlarge) |
![]()
|
FINAL ESTUARINE CONCLUSIONS |
Physically the Fal estuary appears to be well mixed. At the low tide limit up the Turo River there was a layer of fresh water on the surface. This may imply there is a salt wedge up the head of the estuary. As you head seaward out of the estuary mouth the water structure becomes progresivly more stratified. Out in the open western English Channel the water column is fully stratified. Chemically, near the head of the estuary phosphate shows non-conservative behaviour with addition. Further down the estuary phosphate is seen to show conservative behaviour. Nitrate mixing diagrams show conservative behaviour further up the estuary, but non conservative behaviour with loss lower in the estuary. This suggests that generally there is a decrease in the nutrient concentrations further down the estuary. The reason for this is likely to be due to biological activity stripping nutrients from the water column. The biology of the estuary changed as we progressed from the head of the estuary to the mouth. In the upper estuary, the predominant species of zooplankton were Cirrapedia (barnacle) larvae. Further down the estuary Copepoda became the dominant species. Offshore copepods are the dominant zooplankton, with copepod nauplii more abundant in the surface waters. The phytoplankton also showed variation as we progressed down the estuary. In the upper estuary the dominant species was the diatom Nitzschia longissima, further down the estuary there is more variation in the species diversity. However, the diatom Rhizosolenia delicatula was the slightly more dominant species. Near the mouth of the estuary the diatom Rhizosdenia stolterforthii were dominant. These high diatom numbers coincide with the higher silicon concentrations found between the mouth of the estuary and the end of the river Fal. The silicon concentrations are higher due to the degradation of the diatom tests. Further offshore flagellates dominate the in the surface waters but diatoms dominate at the chlorophyll maximum. |
![]()
![]() EQUIPMENT
EQUIPMENT![]()
|
Secchi Disk: The secchi disc is a low-tech, easy to use piece of equipment. It consists of a black and white disk attached to a length of rope. The disk is lowered overboard until the contrasting black and white segments are no longer visible. Once the segments were no longer visible the distance between the seas surface and the Secchi disc was measured and recorded. This depth is known as the Secchi depth. As a rough guide the 1% light level should be three times the Secchi disk depth. |
|
CTD: CTD instruments measure three important parameters, conductivity, temperature and pressure. By measuring conductivity (how easily electric currents pass through the water sample being tested), we can get a measurement of that water sample's salinity. This is because electric current passes much more easily through water with a higher salt content. So if we know the conductivity of the water, we know how much salt is in the water. A CTD instrument usually uses a thermistor, a platinum thermometer, or a combination of these to measure temperature. Finally a CTD instrument measures pressure using either a strain gauge pressure monitor or a quartz crystal-based digital pressure gauge. The CTD can also measure dissolved oxygen, pH, turbidity and flourescence. |
|
Fluorometer: The fluorometer is underwater unit that can be attached to the CTD, this unit is used to measure chlorophyll – an indication of phytoplankton. Ultraviolet pulses are utilised to stimulate fluorescence from the chlorophyll pigment in phytoplankton. The fluorescence is detected by a sensor contained within the instrument, the detector picks up fluorescence at the red end of the light spectrum. Therefore, the more chlorophyll present (and hence phytoplankton) the higher the response. |
|
Niskin Bottle: A Niskin bottle is a plastic tube (plastic is used to minimize contamination) that is open to the water at both ends. Each end is equipped with a cap which is either spring-loaded or tensioned by an elastic rope. The action of the messenger weight is to trip both caps shut and seal the tube. The bottle can therefore be used to collect samples of water from specific depths in the water column. A modern variation of the Niskin bottle uses actuated valves that may be either preset to trip at a specific depth detected by a pressure switch, or remotely controlled to do so via an electrical signal sent from the surface. This arrangement conveniently allows for a large number of Niskin bottles to be mounted together in a circular frame termed a rosette |
|
ADCP: Sound from a transmitter is directed along a narrow beam away from the instrument and is scattered back towards the instrument, often from particles of zooplankton being carried in the current. A receiver compares the pitch of the received and transmitted frequencies, and from their differences, or Doppler shift, calculates the current at different distances from the instrument. |
|
Transmisometer: A Transmissometer is an underwater unit that can be attached to a CTD, it is used to measure beam attenuation in-situ. A light source at one end of around 660nm wavelength is shone through the water and detected at the other end (25cm path length through the water). Light will either be (a) scattered and absorbed (b) by the water and the instrument measures transmission to give (c) attenuation. |
WEBSITE DISCLAIMER
The ideas presented in this website are the initial interpretations of data collected from 4/07/06 to 17/07/06 by second year students from the University of Southampton. The quality of the data and interpretations are ongoing, results and shouldn’t be confused with scientific data collected by professional “official” scientific institutions and agencies.

 scale worm