 Estuarine Survey
Estuarine Survey
Vessel- R.V.
Bill Conway
A Survey of
the Fal estuary and surrounding area
Date: 7/7/06
Survey Time
Duration: 08:13 – 14:05 GMT
Tide: LW at
9.00am BST
HW at 3.00pm BST
Introduction
The practical carried out aboard the Bill Conway was conducted in the Fal estuary which can be classed as a ria or drowned river valley. There is a diurnal 4 metre tide. It is also known that there is a fresh water flux of 2cm3/s as well as a tidal flux of 15,000 cm3/s. Stability within the estuary is particularly important and is determined by the changing salinity with depth. Plankton, the chemistry of the water and the temperature also influences the stability.
Aim and Method
The aim of this practical was to analyse a selected area of the Fal Estuary, ranging from upstream to the mouth, along with decided stations in between. In total, 7 transects were taken throughout the estuary along with 6 CTD samples and 2 surface samples (stations 6 and 8), deployed in the middle of each transect line. At station 2 was there only a CTD cast taken and no transect. 4 of these were taken along the River Fal (station 1-3), with one recording being taken before the fish farm, and the other one after, so that comparisons, especially in nutrients, can be made. Other transects carried out were eastwards from Restronguet Pt. and near Carick Carlys Rock (station 4), Carrick Roads (station 5), along the Saint Mawes Harbour Limit (station 6), the width of the mouth across to Pendennis Point (station 7), and then lastly, northwards towards Falmouth Bank (station 8). Figure 1 illustrates this clearly.
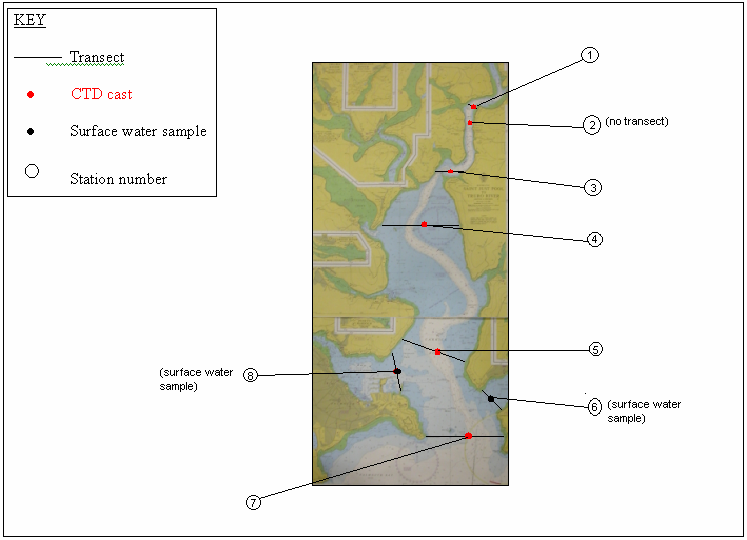
At the stations in which the CTD was deployed (as shown in figure 1) water samples were collected, allowing us to analyse % oxygen saturation, nutrients and chlorophyll concentration in the lab. When collecting the nutrient sample, it is important that the phosphate and nitrate samples are stored in glass bottles and the silicate samples are stored in plastic bottles, to prevent the silicate sample becoming contaminated. The CTD also has a fluorometer and a transmissometer to measure the chlorophyll and turbidity.
At each station, a Secchi disk was deployed to measure the depth of the euphotic zone. Two plankton net (figure 2) trawls were completed, one at the mouth and one upstream, to allow us to observe the possible change in phytoplankton along the estuary.
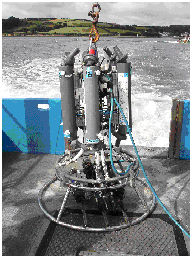
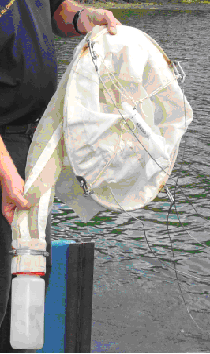
Figure 1: CTD prepared for deployment Figure 2: Plankton net used for horizontal trawl
Physical results and conclusions
Salinity
A halocline of approx 4 salinity units is present at sites 1 and 2 (River Fal) at a depth of 6m (figure 1), thus highlighting the presence of a salt-wedge reaching the upper estuary. This becomes gradually less defined and the waters progressively more homogenous downstream; the halocline dissipates to 0 by station 7 (Shag Rock) at the mouth of the estuary.
An average salinity of 33.3 is found at the top of the estuary compared to a salinity of 35.2 at the mouth. This equates to a difference of approx. only 2 salinity units, suggesting that the estuary is tidally dominated. This is exaggerated by a very low riverine input.
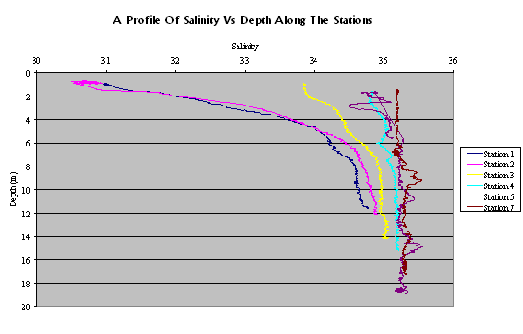
Figure 3: Plot of Salinity against depth for the Fal Estuary
Temperature
Temperature shows a gradual surface decrease from 19.04ºC (station 1) to 16.21ºC (station 7) downstream. At depth temperature decreases from 16.85 ºC (station 1) to 13.95 ºC (station 7) downstream.
There is evidence of a slight thermocline at station 1 at approx. 6m. The thermocline becomes more defined downstream with a strong thermocline at station 7 at approx. 7m, with a temperature change of approx. 2 Celcius.
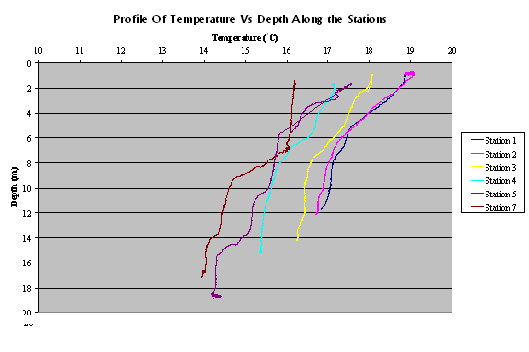
Figure 4: Plot of Temperature against depth for the Fal Estuary
Chlorophyll
Stations 1, 2 and 3 located furthest upstream show a higher chlorophyll concentration over the first 8m; a bloom of 2.08volts (station 1) being found at station 3. Further downstream, stations 4, 5 and 7 chlorophyll is much lower, with maximum values of 1.60volts (station 4), 1.73volts (station 5) and 1.66volts (station 7) being recorded respectively.
For all stations, chlorophyll shows a decrease in concentration with depth, reflecting the exponential decrease in light intensity thus reducing the optimum conditions required to support phytoplankton growth.
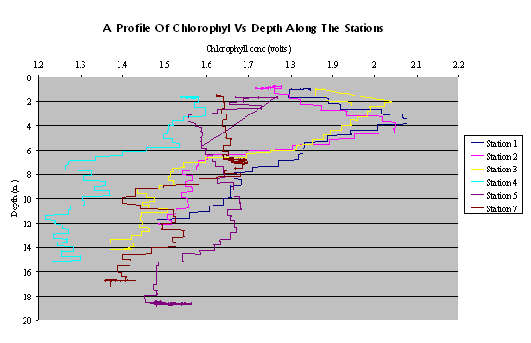
Figure 5: Plot of Chlorophyll against depth for the Fal Estuary
Light
Secchi Disks were deployed at stations 2, 3, 4, 5 and 7, the results of which are shown below (table 1)
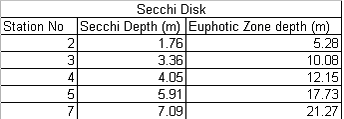
Table 1: Euphotic Zone Calculations
In general water clarity shows improvement with distance downstream, from a euphotic zone depth of 5.28m being calculated at station 2, to one of 21.27m at station 7. This matches the data on the chlorophyll graph, with peaks for stations 1-3 all occurring in the immediate surface waters. For the later stations a deeper euphotic zone would mean that chlorophyll could occur slightly deeper (for example, a peak of 1.54volts, is recorded at 12.83m at station 7), reflecting the increasing depth to which light can penetrate.
ADCP-Current Shear
Calculation of the Richardson Number for current flow at each of these stations is illustrated in the table below (table 2)
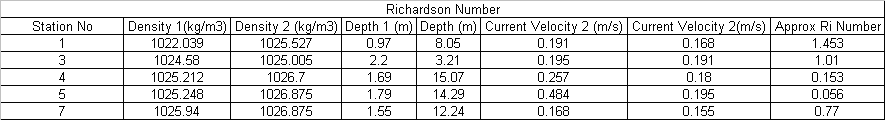
Table 2: Richardson Numbers
Results show that at stations 1 and 2 located furthest upstream, an Ri number of 1.453 (station 1) is calculated, illustrating that the water column is highly stable and that one way advective mixing processes such as entrainment tend to dominate.
Further downstream Ri numbers begin to decrease down to values of 0.77 (station 7). This indicates that the waters here are less stable suggesting increased influence from the tide. At stations 4 and 5 Ri numbers of 0.153 and 0.056 have been calculated, both of which indicate shear instability, and predict that turbulent diffusion mixing processes are more important. This is probably a reflection of the effect of the tide at different points within the estuary. Near the mouth of the estuary, tidal currents are stronger and so turbulent mixing is more likely to occur, thus producing a better mixed water column. This is what we find with at the stations 4 and 5 (see graph 3). In contrast, near the head of the estuary tidal currents have a much weaker effect and so stratification works to stabilize the water column. Hence why we have such a high Ri number of 1.453 calculated (see table 2) and the presence of a salt wedge at stations 1 and 2, thus further illustrating stability.
Chemical results and conclusions
Nitrate
The estuarine mixing diagram produced from the nitrate data shows a decrease in nitrate concentration downstream. Behaviour of nitrate is fairly conservative along the profile, with some small decrease at the mouth of the estuary. This is probably due to dissipation by the tide or utilisation by phytoplankton.
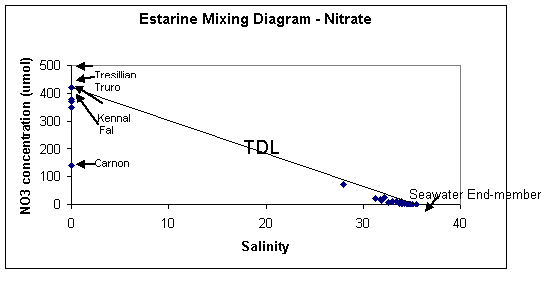
Figure 6- Nitrate Estuarine Mixing Diagram
The Fal Estuary is identified as a Nitrate Vulnerable Zone (NVZ) by the Nitrate Directive. The Nitrates Directive was adopted as a result of concern over water pollution caused by nitrate (NO3-) derived from agriculture. This project considers the role of nutrients and other factors in the eutrophication of England’s estuaries, with an aim of developing a new strategy for protecting NVZs in the future.
Phosphate
The estuarine mixing diagram for phosphate shows a decrease in phosphate downstream. Behaviour is relatively conservative, although the estuarine mixing diagram does indicate a degree of addition of phosphate within the estuary near the mouth. This is likely to be due to agricultural runoff or input from tributaries. Agriculture involves the addition of fertilisers into the ground and can lead to leaching of nutrients into river water thus addition to the estuary.
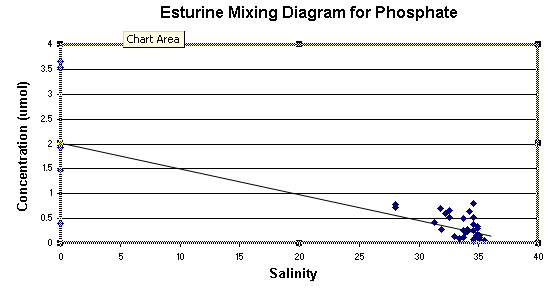
Figure 7: Phosphate Estuarine Mixing Diagram
Silicate
Fig. 8 shows a decrease in silicate towards the marine end member, indicating a degree of utilisation by organisms (most probably diatoms) in the water column. The behaviour is uniformly conservative, although Silicate has the potential to behave in a non-conservative way in an estuarine environment. Chlorophyll concentration is lower at the mouth and therefore silicate utilisation is likely to be less. This is reflected in the conservative behaviour in Fig. 8.
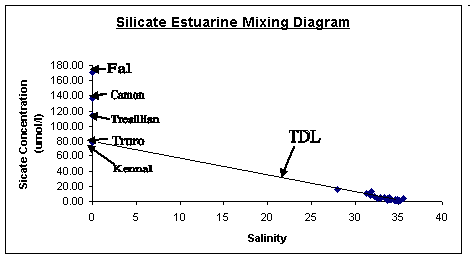
Figure 8: Silicate Estuarine Mixing Diagram
Biological Results and Conclusions
Oxygen
Water samples from the survey were analysed using Thiosulphate titration, to find the dissolved oxygen concentration and therefore the % oxygen saturation of the water. In general the oxygen saturation decreased with depth, although not at a uniform rate. The highest saturations were found at the surface at Station 2 (485.6%) and at the surface at Station 7 (475.1%). Station 4 showed an increase in saturation from 86.8% at the surface to 101.3% at 15m depth. This could be a result of heavy metal pollution from Restronguet Creek, although we cannot conclude this for certain without further investigation.
Chlorophyll
The euphotic zone in the estuary is at approximately 15m, and this is reflected in the chlorophyll concentrations. Chlorophyll was measured as an indication of phytoplankton biomass in the water column, and should therefore be present in high concentration in areas of high phytoplankton, and visa versa. This is shown in the data set, as chlorophyll is present throughout the whole water column, with only a small amount of change between stations.
Estuarine ADCP
ADCP transects where taken at 8 points along the estuary; the general pattern observed was faster, northward flows in the main channel and slower flows with more varied directions outside of the main channel. The tidal flow is restricted topographically to the centre of the channel however either side of the channel it is greatly reduced due to frictional dissipation (u3). This, in theory allows river flow to dominate at the sides of the estuary. For example Station 5.
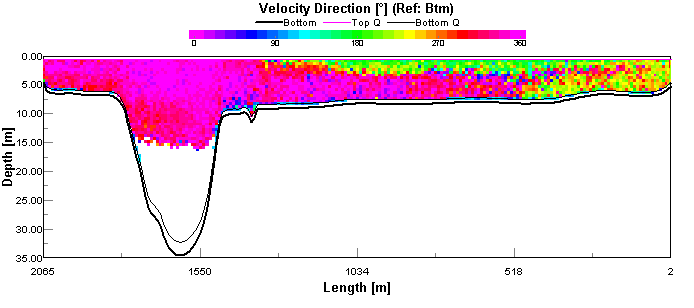
Figure 9. Site 5 ADCP velocity direction
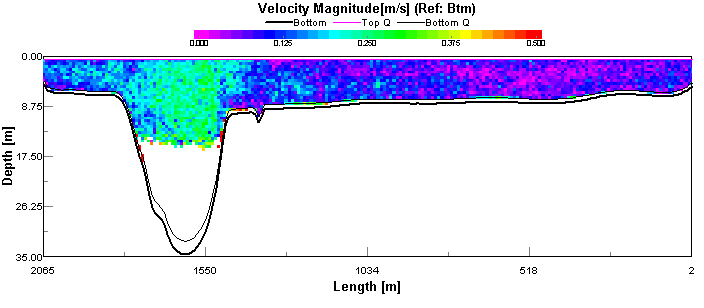
Figure 10. Site 5 ADCP Velocity Magnitude
A limitation is also highlighted by this graphical representation of the data and that is the inability of the equipment to profile current magnitude or direction to depths greater than 15m, this limitation affects the entire survey. The contour plot also displays riverine flow in the estuary which has a lower flow magnitude and is in the opposite direction to the tidal flow.
A similar pattern can be seen in the transect at station 7
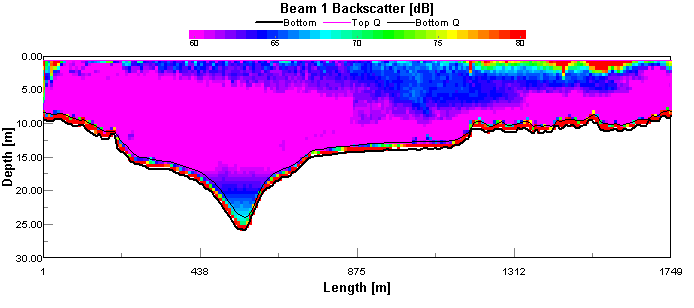
Figure 11. Site 7 ADCP backscatter
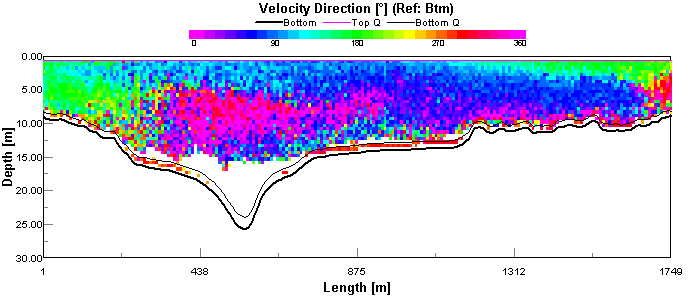
Figure 12. Site 7 ADCP velocity Direction
The Contour Plots here shows high levels of backscatter coincide with definite southward flows on both sides of the estuary. The backscatter in this case is likely to be caused by inorganic material carried in the river. The contributing rivers at this location are Penryn River and Percuil River). The low magnitude of these river flows in relation to the main channel tidal flows acts as proof that the Fal is a tidally dominated estuary.
Phytoplankton
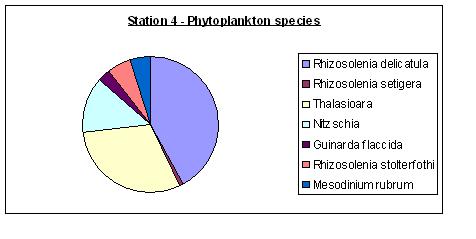
Figure 13. Phytoplankton distribution for Station 4
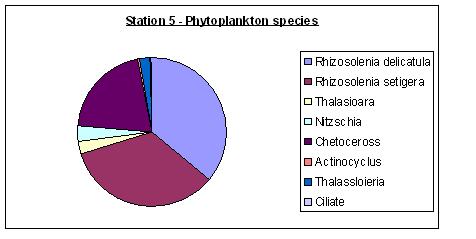
Figure 14. Phytoplankton distribution Station 5
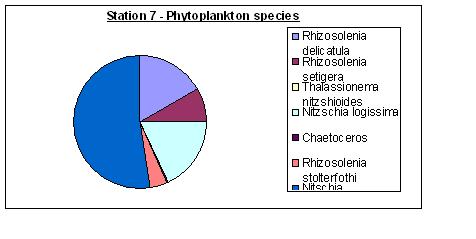
Figure 15. Phytoplankton distribution at station 7
One of the main features noticed about the phytoplankton collected aboard the R.V. Bill Conway, is that nearly all the species found are diatoms. This suggests that the conditions at this time of year are perfect for their populations.
It can also be noted that at each station, other than at 4 and 5, different species of diatom are dominant. At station 1, this species is Rhizosolenia setigera, while at stations 4 and 5 the most abundant species is Rhizosolenia delicatula. 50% of station 7 species’ consists of Nitschia.
Data files
Designed by group 2 © 2006