 H.V. Grey Bear - Geophysics Estuarine Survey
H.V. Grey Bear - Geophysics Estuarine Survey
A Survey of the Fal estuary and surrounding area
Date: 4/7/06
Survey Time Duration: 08:13 – 14:05 GMT
Tide: HW at 11.20GMT (4/7/06), 4.5m
Introduction
The main aim of this investigation was to survey a selected area of the Fal Estuary, and analyse the sediment and benthic life forms within. This involved a sea floor analysis of Carrick Roads (50°10.1N, 005°2.3W), using an acoustically powered side scan sonar system aboard the H.V Grey Bear. Whilst surveying the area, particular attention was paid towards identifying key sediment structures, types, bedforms and rock outcrops, along with important anthropogenic features such as wrecks, pipes and sewage outfalls. The dimensions and positions of such objects and the effect which they have on the side scan sonar record was later analysed back in a lab and a seafloor geological map was produced (Figure 7).
Carrick Roads is situated in the upper Fal estuary (Penryn Harbour), close to the neighbouring town of Penryn. A map showing the location of Carrick Roads within Falmouth estuary, and its surroundings is shown below (Figure 2).
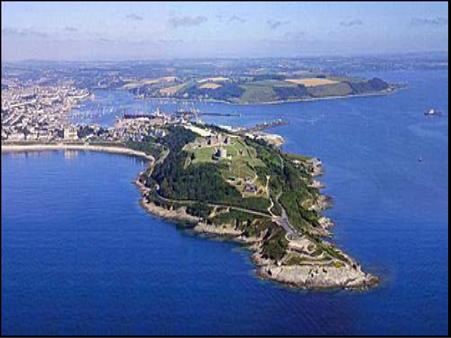
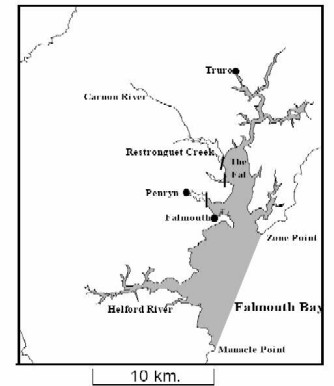
Figure 1. Photograph showing the Fal Estuary and its surroundings (photo by Mike Cudlipp, Twinbrook, Falmouth, in Characterisation of European Marine Sites; The Fal and Helford, (candidate) Special Area of Conservation. Marine Biological Association Occasion Publication No. 8. P1-174)
Figure 2. A map showing the location of Carrick Roads within Falmouth Harbour and its surroundings.
Method
In this investigation the side scan sonar instrument was deployed over the port side of the ship and 6 parallel survey lines were undertaken 100m apart and 1km long (Figure 4). The fish was lowered to a depth of 4m below the sea surface and the vessel surveyed at a speed of 4 knots.
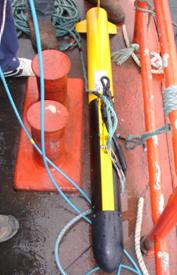
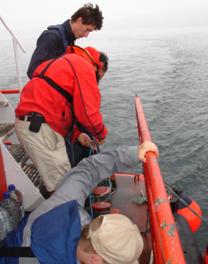
Figure 3/4. Pictures showing the deployment of the side scan sonar over the side of the Grey Bear
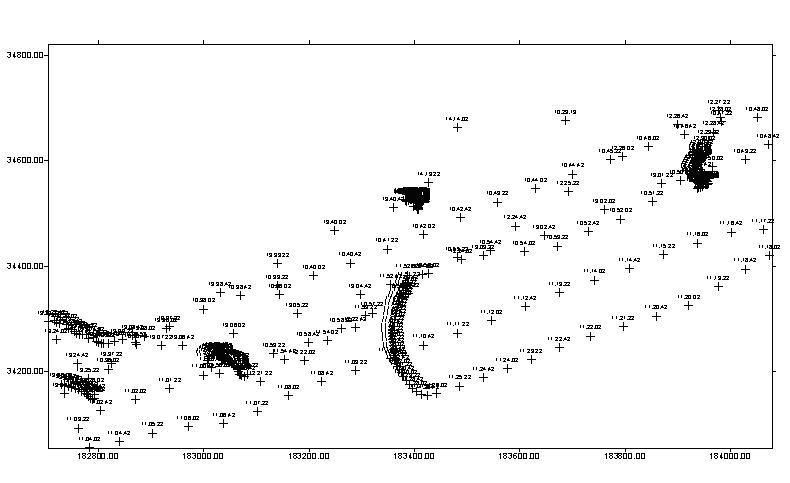
Figure 5. Map of track followed during the side scan sonar.
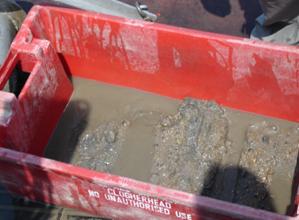
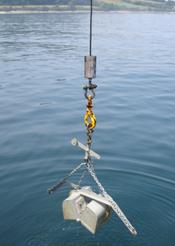
Figure 5 (left). Picture of sediment sample taken using a Van Veen Grab
Figure 6(right) Picture of Grab used during geophysical practical.
Results
The side scan records and the grab sample observations were analysed the following day and the following results were obtained.
Side scan sonar of Carrick Roads revealed that seafloor sediments are composed mainly of 3 different sedimentary units.
One of the sedimentary units appeared very pale on the side scan image, indicating that fine mud might be present. Two separate grab samples (Sample numbers 3 and 4 – table 2 and 3) at different locations within these light coloured areas confirmed the presence of organic rich fine mud sediment. It was also very anoxic and smelt similar to rotten eggs, suggesting the presence of hydrogen sulphide. The organisms present were restricted to those able to survive in these extreme conditions. A list of the biological life forms found living in sediment, at each site of grab deployment is illustrated in tables 1-4.
Another area observed on the side scan image had a much stronger return. This was expected to be a much harder sediment substrate, consisting of much coarser grained sandy material than that of the previous unit sampled. Again a grab sample (Table 4) taken in this location confirmed this assumption, with organic rich, coarse grained sands being found here. Broken up shells of the remains of calcareous mearl (Phymatolithon calcareum) were found (figure 7).
A final grab (sample 1) was taken from an interesting area of the side scan record to try and determine what was causing the reading (Table 1).
The side scan also picked up a very strong return within a small area of the region studied, and this was attributed to be some form of bedrock, possibly slate given the geology surrounding the Carrick Roads region which was surveyed. A lack of equipment meant that we were unable to undergo a grab sample for this area to quantify our initial predictions.
Estimates from the side scan record taken suggested that the percentage composition of the sediment present comprised mostly of 60% coarse sandy material, 35% organic rich mud and 5% bedrock.
The chart indicated the position of an old shipwreck, which was picked up by the side scan sonar. Due to the wreck being considerably damaged it produced a very blotchy picture on the side scan record and so estimates of its size were very robust. At 150m long and 40m wide, this is more likely the total area covered by the various broken components of the wreck, rather then the size of the wreck itself.
Grab results
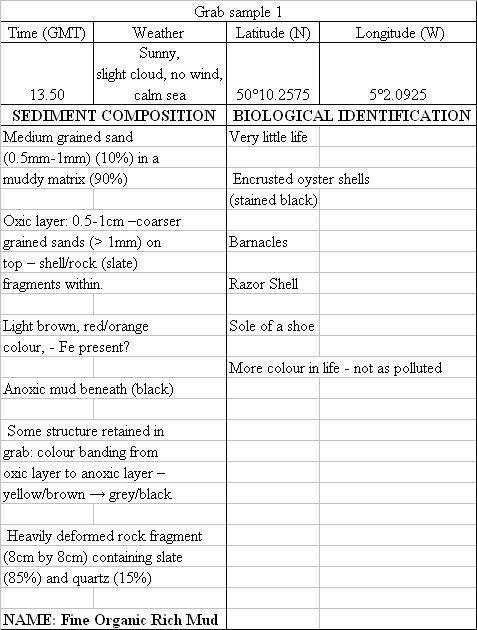 Table 1(left).Table of results
illustrating findings from grab site 1
Table 1(left).Table of results
illustrating findings from grab site 1
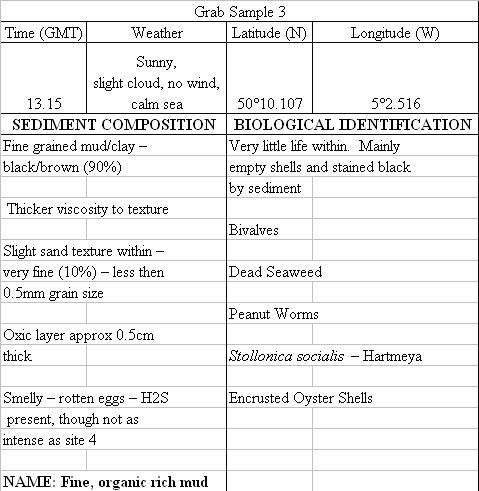 Table 2 (right).Table of results
illustrating findings from grab site 1
Table 2 (right).Table of results
illustrating findings from grab site 1
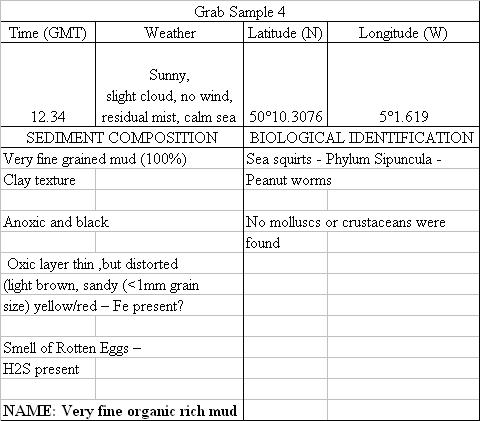 Table 3.Table of results
illustrating findings from grab site 4
Table 3.Table of results
illustrating findings from grab site 4
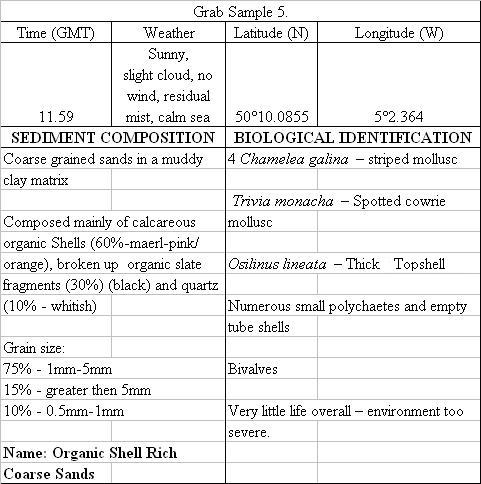 Table 4.Table of results
illustrating findings from grab site 5
Table 4.Table of results
illustrating findings from grab site 5
References
Johnson, H.P and Helferty, M. 1990. Geological interpretation of side scan sonar. Reviews of Geophysics. 28. 4. pp 357-380
Data Files
Designed by group 2 © 2006