 River Survey
River Survey
Vessel(s): Ocean Adventure and
Coastal Research
Date: 14/07/06
Survey Time Duration: 7:20 GMT- 12:50 GMT
Tide: HW 07:20GMT
LW 13:50GMT
CTD results
Salinity
Figure 1 shows that salinity increases with distance down the river, as is expected. Salinity readings furthest up the river near Truro, recorded a value of 17.12, compared with that of 34.58 at Turnaware Bar (station 16, at the head of estuary). Most of the salinity changes occur in the upper reaches of the river; between stations 1-4 salinity shows an increase from 17.12 at the surface to 33.13 at 1m. This equates to a change of 16 salinity units in just 1.5km, highlighting the dominance of the tidal influence within this particular estuary.
Increased tidal impact with distance down the estuary, leads to an increase in turbulence. This creates an increase in vertical mixing, thus producing a change in estuarine structure from a salt wedge type estuary furthest upstream (Truro) to one which is progressively more homogenous with depth.
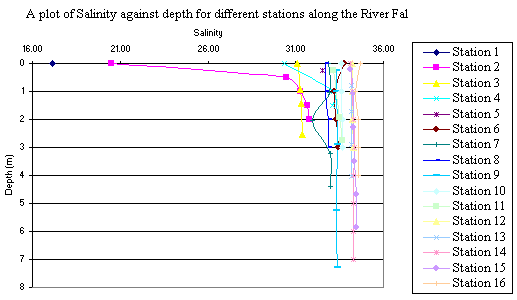
Figure 1: CTD data from station 1 showing salinity at all stations
Temperature
Temperature does not show a trend with distance down the estuary, however it does in general show a typical decrease with depth. Such variability in the data could reflect the different times that data was collected. Increased solar heating of the water column, injecting more thermal energy into it over time, means that some areas will have been warmer.
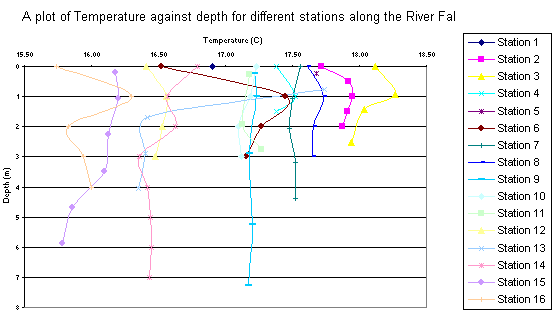
Figure 2: CTD data showing temperature at all stations
Oxygen
Similar to temperature, dissolved oxygen shows no real trend downstream or with depth. Such results could be explained by the chlorophyll results obtained yet these were only taken at the surface and can not explain results found deeper down (see chlorophyll results for interpretation). In general it appears that oxygen shows an increase down with depth for most of the upstream stations (stations 1-8). For example at station 2 surface dissolved oxygen records a value 118.0%, and then increases to 140.9% at 2m depth.
Further downstream, dissolved oxygen values generally show a decrease with depth (stations 9-16). The deeper water here and limited light penetration, means that primary production is limited to the surface waters, thus explaining the higher percentage oxygen recorded (for example a surface value of 155.6% at station 9, compared with 133.9% at 7m depth).
The fact that all stations record percentage oxygen values higher then 100% illustrate that these waters are supersaturated and that primary production is occurring at a very high rate. This is expected in the Fal estuary, since nutrient concentrations here are greater then normal, given its surroundings (untreated sewage outfall, extensive agriculture). This in turn triggers unusually high phytoplankton blooms and hence explains the high % oxygen values produced.
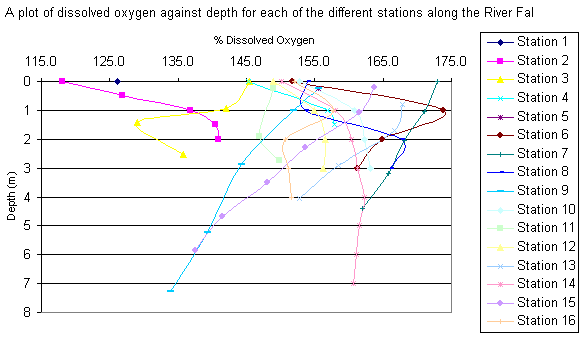
Figure 3: CTD data showing oxygen at all stations
Light
Results for the Secchi disk data show that recorded Secchi depths (Zs) and resultant euphotic zone (Ze) depths increase with depth downstream from a Zs value of 56cm equating to a Ze of 168cm (3*Zs) at station 2 to a Zs value of 250cm and Ze of 750cm at station 16. This shows that water clarity improves downstream and that light can penetrate to a deeper depth. Increased light attenuation coefficients (k) downstream confirm this; k at station 2 equals 80.64m-1 where as at station 16, it reaches 360m-1
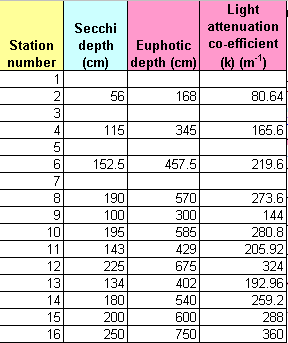
Table 1: Table showing Secchi Disk measurements at all stations
Phytoplankton
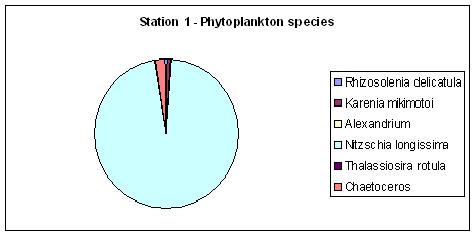
Figure 4. Phytoplankton at Station 1
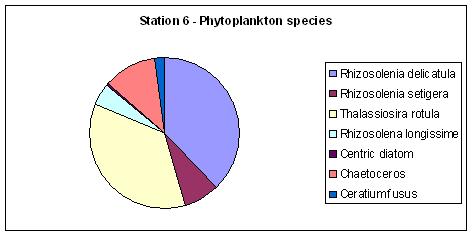
Figure 5. Phytoplankton at Station 6
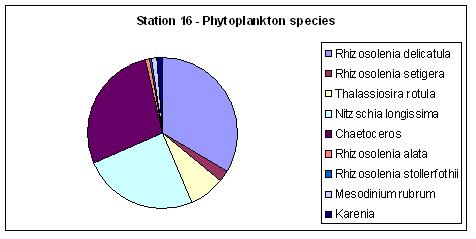
Figure 6. Phytoplankton at station 16
The phytoplankton
species found along the Fal River are mainly diatoms with only a few ciliates
recorded. Another pattern noticeable is that there are less species upstream
than there are downstream. For example, at station 1, there was a total of
10010 Nitzschia longissima
and only 5 other species, while at the last station (16),
there were 9 species recorded. This ties in with the theory that there are a
greater variety of conditions lower downstream as well as there being a higher
salinity. Most phytoplankton can tolerate a higher salinity rather than a lower
one in fresh water.
Chlorophyll growth and nutrient analysis
Chlorophyll concentration is highly variable along the River Fal, increasing and decreasing at different points within. This reflects the growth of different phytoplankton species of which are tolerant to different salinity ranges; for example there appears to be a small bloom of 2.33ug/l at a salinity range of 4, in which the species within differ from those present in the bloom of 5.51ug/l at 34.7. The different species found at these 2 extreme salinities, and which illustrate this relationship well can be seen if you study the phytoplankton results obtained.
Analysis of chlorophyll concentration with the nutrients phosphate and silicon show a typical relationship where when nutrient concentrations are high, typically 2.5826umol/l and 46.6250umol/l for phosphate and silicon respectively, chlorophyll responds by increasing (up to a value of 6.63ug/l), as conditions are optimum for photosynthetic growth. Elsewhere, where nutrient concentrations are low; 0.2305umol/l and -0.5417umol/l for example, chlorophyll concentrations are also low (2.58ug/l), as conditions are no longer suitable. Such a relationship explained here is shown in the graph below (figure 1). It appears that phosphate is the most limiting out of all the nutrients towards phytoplankton growth, with growth rates changing in accordance to phosphate changes more so then for the other nutrients.
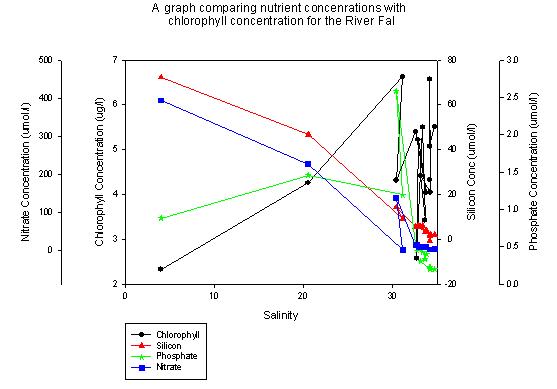
Figure 7. A graph of nutrient concentrations and chlorophyll
Silicon
Results show that silicon concentrations are higher up the river then they are downstream as is expected. At station 1, Truro for example, silicon concentrations records a value of 72.375umol/l, where as further downstream (station 16) much lower concentrations of 2.125umol/l are found. Analysis of silicon on an estuarine mixing diagram (shown below) shows typical conservative behaviour downstream. There appears to be a slight addition to the estuarine system at salinity 20.5, however a lack of data here questions the reliability of this outcome. A lack of data in the middle of the diagram is a reflection of the rapid changes in salinity experienced within this tidally dominated estuary.
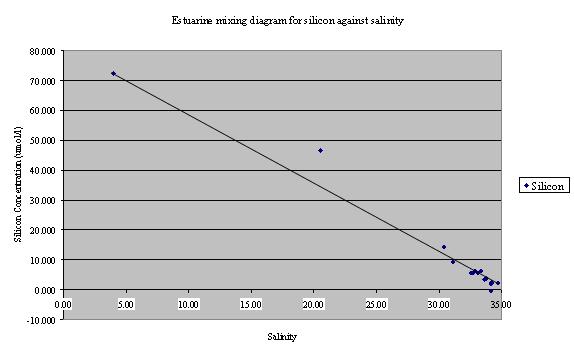
Figure 8. Estuarine mixing diagram for Silicon
Phosphate
The estuarine mixing diagram for the RIBS data shows that there is addition of phosphate to the estuarine system; this pattern was also observed in the estuarine boat practical on R.V. Bill Conway. The addition could be due to the use of fertilizers in local farms, causing enhanced leaching of nutrients into riverine systems. Phosphate becomes more conservative at higher salinities. Approaching the main estuary salinity reaches levels of 34 and phosphate is conservative. However at station 4 (sunny corner) and a salinity of 30 there are recordings of further phosphate additions, only 5 miles upstream. Thus it is apparent that a large amount of dilution takes place downstream between 50°14.959 5°02.244 and 50°12.427 5°02.244. A graph showing phosphates relationship downstream is shown below.
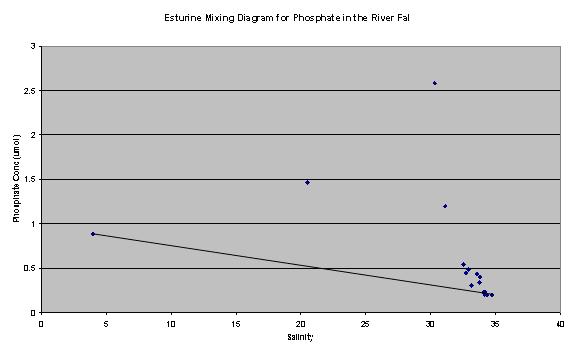
Figure 9. Estuarine Mixing Diagram for Phosphate
Nitrate
Nitrate levels show a higher nutrient concentration upstream within the river, than they do downstream. Results show a nitrate concentration of 393.989umol/l
at station 1, Truro. By station 16, this has dramatically reduced to 1.125umol/l. This can be viewed as the freshwater end of an estuarine mixing diagram, and therefore shows conservative behaviour around the theoretical dilution line. The Fal Estuary is a Nitrate sensitive area (see Estuarine Survey RV Bill Conway for further information), and the presence of such high levels of Nitrate in the River Truro support this fact. In the spring and summer months, this peak in nutrients would result in an unusually large phytoplankton bloom, indicted by high chlorophyll levels. This can be seen in our chlorophyll data collected above.
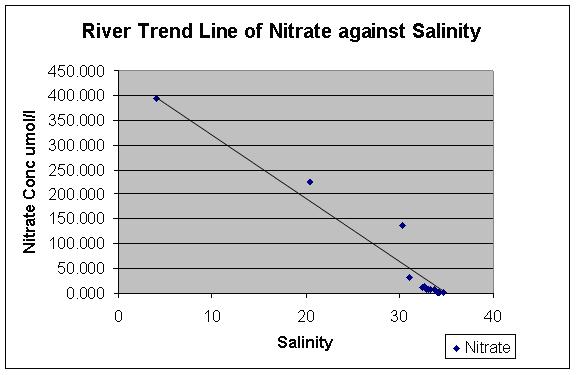
Figure 10. Graph of nitrate against salinity
Data Files
Designed by group 2 © 2006