 Offshore
Survey
Offshore
Survey
Offshore
Survey
Vessel: R.V Callista
Date: 11/07/06
Survey Time Duration: 9:05 GMT- 14:31 GMT
Tide: HW 5:00GMT
LW 11:30GMT
Introduction
The aim of this survey was to study the distributions of water properties and main types of phytoplankton and zooplankton offshore. This involved analysing the water column structure using an ADCP and a CTD at five different stations. The ADCP was used to gain a current profile across the transects and at each station. The CTD rosette was used to take water samples and create vertical profiles for temperature, salinity, turbidity and fluorescence. The first station was at Black Rock (50º08.378N, 05º01.472W) which was situated on the coastal side of the boundary of the front. The second station was then situated on the oceanic side of the front (50º 05.302N, 05º 58.166W). The third station was then situated, like the first station, on the coastal side of the front (50º 05.590N, 04º 57.986W). Figure 1 shows a general plan of the first three stations in relation to the front. At every site an ADCP was taken and transects were also taken between station 1 and 2 and then between stations 2 and 3. The fourth station was located approx. 15 miles offshore in a South Easterly direction (49º 57.123N, 04º 45.436W) and the fifth station was approx. 1 mile away from station 4 (49º 56.496N, 04º 43.406W). An ADCP was also taken at stations 4 and 5 and a transect was also taken between station 4 and 5.
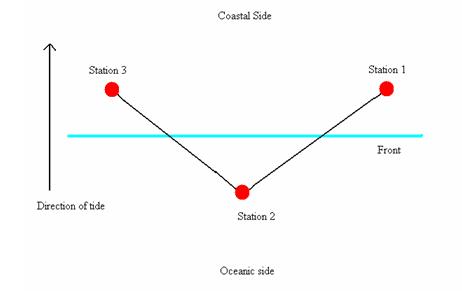
Figure 1. A schematic showing relative positions of the first
three stations.
Method
At every site an ADCP was used and a CTD was deployed. As previously mentioned the CTD creates vertical profiles for temperature, salinity, turbidity and fluorescence. These profiles were then used to decide on various depths within the water column to take water samples. At each station approx. three depths were chosen to sample. Water samples were collected in order to analyse silicate, nitrate, phosphate and chlorophyll concentrations within the water column. A closing zooplankton net was used at every site to collect samples from chosen depths. A secchi disk was also used to obtain the approximate depth of the euphotic zone at each site. Transects were taken using the ADCP between station 1 and 2, 2 and 3 and 4 and 5.
Results
Site 1- Estuary mouth
Results for temperature decrease with depth, from a surface value of 14.738 ºC down to 13.2778 ºC, at 15.1131m deep. There is evidence of a gradual thermocline of 0.93C, located over a depth range of 2.3-8m. Beyond this more homogenous conditions prevail; temperatures ranging by no more then 0.5C from the base of the thermocline to the bottom (figure 1).
Salinity increases with depth down from a surface value of 35.0894 to 35.3094. There is no significant halocline present but a considerable increase in salinity, does occur at 12-15m depth, indicating the presence of the intruding denser seawater during the flooding tide.
Other then that conditions for salinity remain fairly homogenous throughout.
Density shows a gradual increase with depth down from a surface value of 26.1033 kg/m3 to 26.6443kg/m3 15m down. There is no evidence of a pycnocline.
Chlorophyll data shows evidence of 2 distinct chlorophyll maxima; a smaller maxima at the base of the thermocline and larger maxima deeper down at 12.25m.
Turbidity shows a rapid decrease down with depth from 12.2448 volts at the surface rapidly down to 4.0965 volts deeper down. This could be the result of the changing tide, with increased river flow leading to an increase in the amount of sediment in suspension and thus an increase in turbidity at the surface.
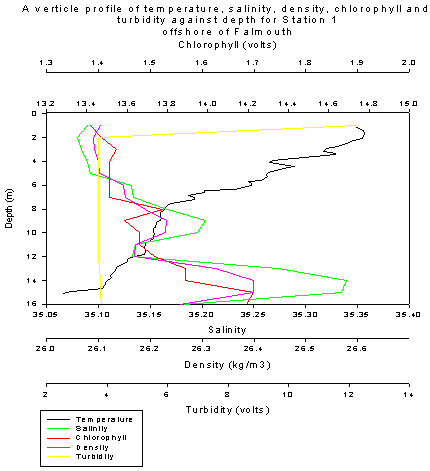
Figure 2: CTD data from station 1
Sites 2 and 3 - The Front
Temperatures here show a decrease with depth, both sites also show a measurable thermocline of about 2ºC (site 2) to 3 ºC (site 3) located at a depth of 10-20m; This is a reflection of the typical characteristics found at a tidal front.
Salinity and density both show similar trends at the 2 sites, both increasing with depth (figure 2 and 3). At site 2, chlorophyll results show evidence of 2 chlorophyll maximums, 1 within the main thermocline at 10.82m and a larger one at approx. 40m.
The turbidity results highlight the inverse relationship between turbidity and chlorophyll.
Figure 3: CTD data from station 2
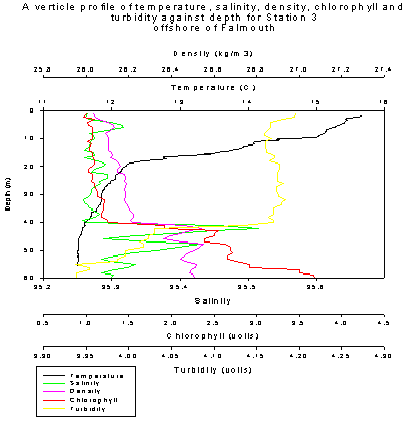
Fig 4: CTD data from Station 3
Sites 4 and 5 - Offshore
Stations 4 and 5 are situated offshore, at 16miles and 17miles. The temperature shows a strong thermocline at 18m, dropping 6 ºC over a 5m depth, a significant change. This temperature drop was also found to coincide with an area of reduced flow which was picked up on the ADCP record (site 4). Such a feature remains a mystery, though possible thoughts indicate it may be the result of refraction of the sound wave from the ADCP caused by such a rapid change in temperature and subsequent change in density. Another possibility is that of internal wave breaking.
The surface waters are generally well mixed down to the thermocline, possibly as a result of storms over the two days before surveying took place. As a result of the recent storm the thermocline depth has been rapidly reduced to a shallower depth from what it was (40m prior to the storm, 10-20m after).
Salinity and density show no real trend with depth.
Chlorophyll and turbidity again show an inverse relationship. There is a peak in chlorophyll at 50m of 5-6volts (site 4), matching the turbidity decrease of 3.7 volts at an equivalent depth.
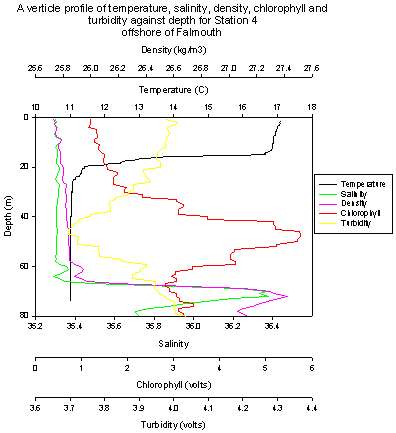
Figure 5: CTD data from station 4
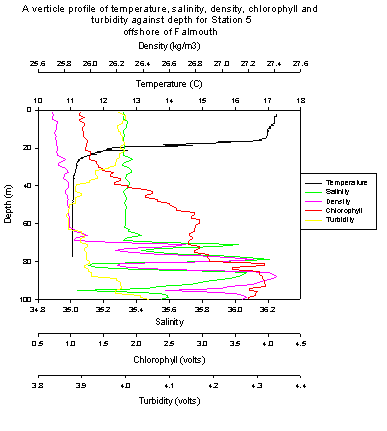
Figure 6: CTD data from station 5
Offshore ADCP data
Station 3
Taken at the tidal front approx. 2 miles from the estuary mouth; There are still south/southwest flows but magnitude is 0.2 m/s this reduced flow is due to tidal currents. The data was taken at 13:04 BST and low tide in Falmouth was at 12:30 BST. This can by explained by tidal phase difference as the station was 2 miles offshore of Falmouth. This station was taken at the tidal front and as expected there are large levels of backscatter (80+dB) which indicate a spring bloom of chlorophyll at the thermocline (shown by CTD data to be from 10-20m).

Figure 7: ADCP data from station 3 showing backscatter

Figure 8: ADCP data from station 3 showing velocity direction

Figure 9: ADCP data from station 3 showing velocity magnitude.
Taken from Black Rock in the mouth of the estuary out to approx. 2 miles offshore from the mouth; The flow direction can be seen to change from a southwest direction to a south direction away from the mouth of the estuary. The southwest direction of the current at the mouth of the estuary is due to the shape and depth of the channel, this could also be the reason for a smaller current magnitude closer to the mouth of the estuary. As the boat travelled further from the influence of the estuary the current direction became southward and the current magnitude increased by 0.2-0.3 m/s. The backscatter profile shows that the main area of high backscatter is within the first 25m of the water column, here backscatter readings are between 70 and 80+dB whereas below this backscatter readings are between 60 and 65dB. This is with exception to the area around the front (~50°6.221N 4°59.081W or ensemble no.3180). Where readings of 70dB penetrate to a depth of 45m and exceptionally high readings of 80+dB occur at 10-15m depth showing the plankton bloom at the thermocline.
![]()
Figure 10: ADCP data showing backscatter from transect 1
As demonstrated in the contour plot for station 3, reduced flow was observed at the thermocline in several profiles offshore of the Fal. It is as yet unknown whether the ADCP is displaying genuine reduced flow or if this is in fact an artefact of the instrument itself. Following this discovery research has begun into the exact cause of the unexpected data.
Nutrient Data and Analysis
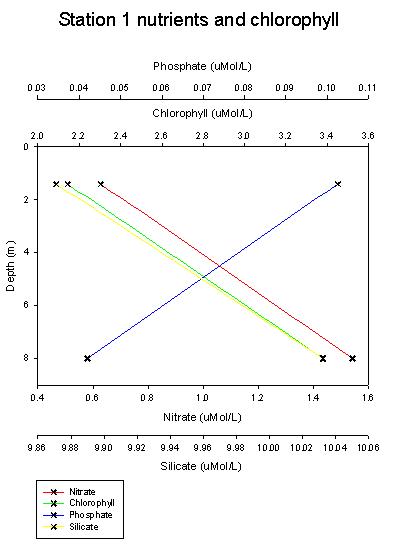
Figure 11. Nutrient and Chlorophyll graph for Station 1
Station 1
The chlorophyll increase with
depth is probably due to an increase in nitrate and silicate with depth. This
has probably occurred due to nutrients being stripped from surface waters by
blooms earlier in the year. Phosphate decreases with depth suggesting that
there may be a freshwater phosphate input near station 1, maintaining a high
phosphate concentration near the surface.
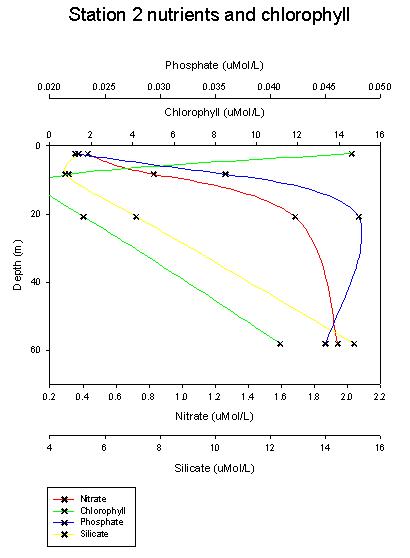
Figure 12. Nutrient and chlorophyll graph for Station 2
Station 2
Station 2 was taken over the offshore front. The graph of nutrients and chlorophyll is not as expected; the best explanation is that the chlorophyll is mainly represented by diatoms which are heavily reliant on silicate. Silicate concentrations are low at the surface due to high utilisation and drop to almost 0 at approx. 10m. This is followed by a large drop in chlorophyll. The water column becomes more mixed so more silicate is introduced and chlorophyll can increase with depth.
The presence of the front and the recent storm activity in the area has made these results very difficult to analyse.
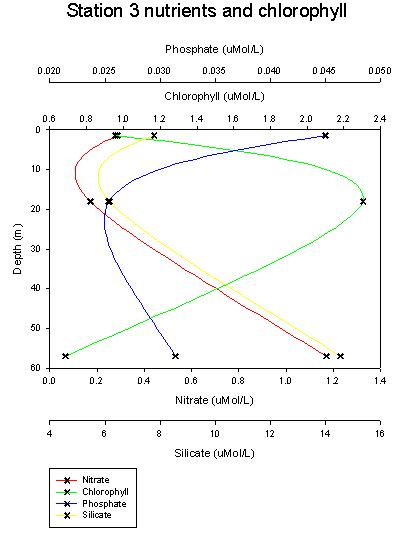
Figure 13. Nutrient and cholorphyll graph for Station 3
Station 3
From the surface there is chlorophyll increase up to a chlorophyll maximum at 20m. This probably represents the bottom of the euphotic zone below which phytoplankton cannot photosynthesise. The reduction in phytoplankton utilisation and mixing processes in the deeper water leads to a nutrient increase with depth after approx. 20m
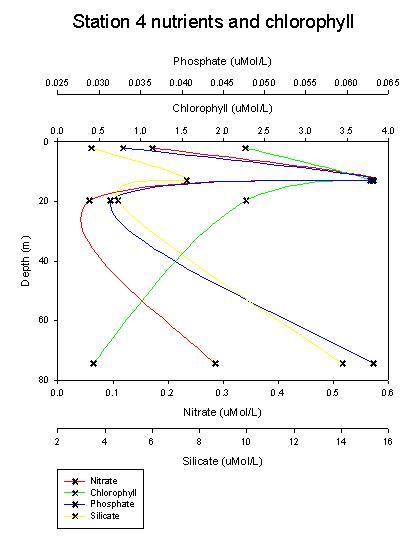
Figure 14. Nutrient and chlorophyll graph for Station 4
Station 4
Station 4 shows a very strong
chlorophyll maximum at approx. 16m. Chlorophyll and nutrients all increase with
depth up to this point after which there is a decrease in chlorophyll and steady
increase in nutrients. In surface waters the nutrients are depleted but a few
metres below the surface nutrients are still available and chlorophyll increases
accordingly. Eventually chlorophyll reaches a maximum of nutrients and light
and below this depth chlorophyll steadily decreases. Accordingly nutrients fall
away at the chlorophyll max. depth but increase in concentration as primary
production decreases.
Phytoplankton
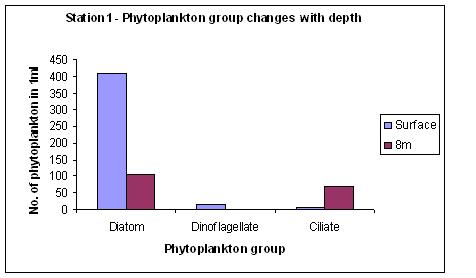
Figure 15. Phytoplankton at Station 1
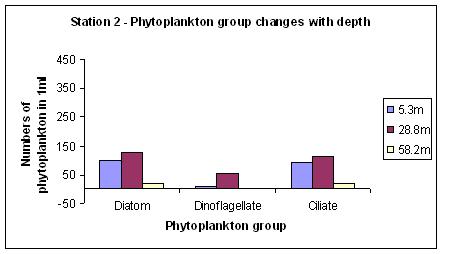
Figure 16. Phytoplankton at Station 2
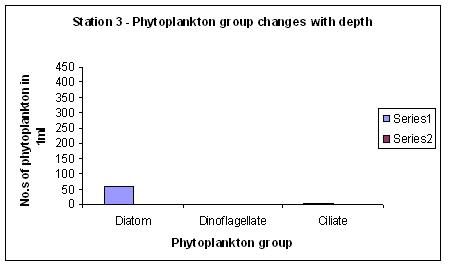
Figure 17. Phytoplankton at Station 3
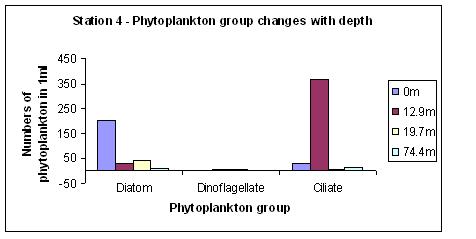
Figure 18.Phytoplankton at Station 4
As would be expected the
highest numbers of phytoplankton were found above the thermocline throughout the
survey area, although at all sample sites there were some phytoplankton found in
deep waters. This suggests that the phytoplankton are getting mixed down the
water column. In the surface samples the most abundant phytoplankton appeared to
be Rhizosolenia sp. Karenia mikimotoi was the single most abundant
species found.
At all stations except station 4, diatoms were the most abundant group, with dinoflagellates always having the least number of representatives. Station 4 has the majority of ciliates, indicating that they might prefer more seaward conditions. Another point to note is that diatoms are not motile, so rely on turbulence within the water column. However, dinoflagellates are motile so are able to position themselves just above the thermocline where the is normally the most nutrients available as well as sufficient light intensity.
Data files
Click here for data files
Designed by group 2 © 2006