Results of Modelling Study

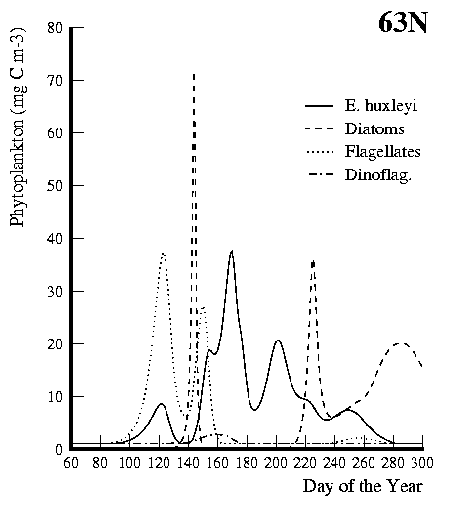
This figure shows model calculations of the phytoplankton seasonal
succession in the NE Atlantic at (63N,20W). Diatoms, Ehux,
flagellates and dinoflagellates are shown. Picophytoplankton were also
modelled but never exceeded 10 mg C m-3 in the model.

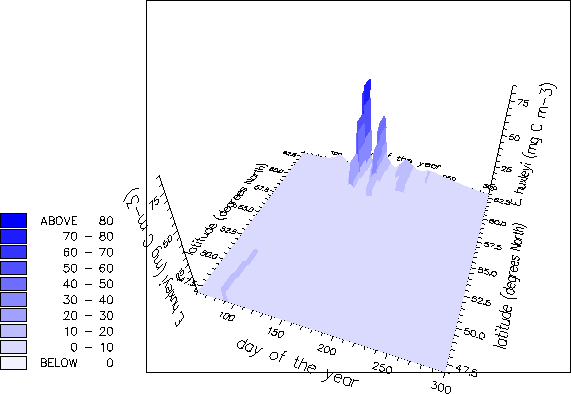
This is a picture of the pattern of Ehux blooms generated by the
final version of the model, displayed from days 60 to 300 and over the whole
latitudinal range from 47N to 63N. This figure shows that the model can
produce blooms in the correct places and at the correct times: i.e. during
June and July from about 60 to 63N (along the line of 20W). For this output
Ehux was given a competitive advantage at high light and at low
phosphate (high N:P ratios).
Ehux
home page
Toby Tyrrell : T.Tyrrell@noc.soton.ac.uk

